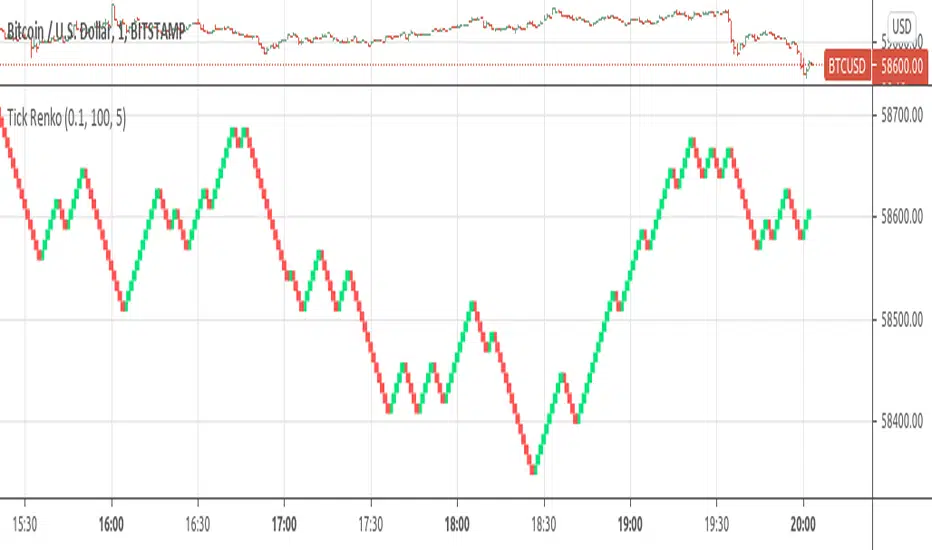
Tick RenkoTick Renko, bars are formed on live chart. note:there is a issue that creates artifacts while there is not enough history loaded.Indicador Pine Script®por RicardoSantos2323 1.6 K
Volume BarsVolume Sato's Bar / Satos Bar / Raio X Preditivo This is an experimental code based on Satos Bar by Raio X Preditivo It's a way to check expressive volume in one bar, and it's can give you an idea of a important Zones to make decisions. Example: Indicador Pine Script®por rafaelfernandesadvogado95
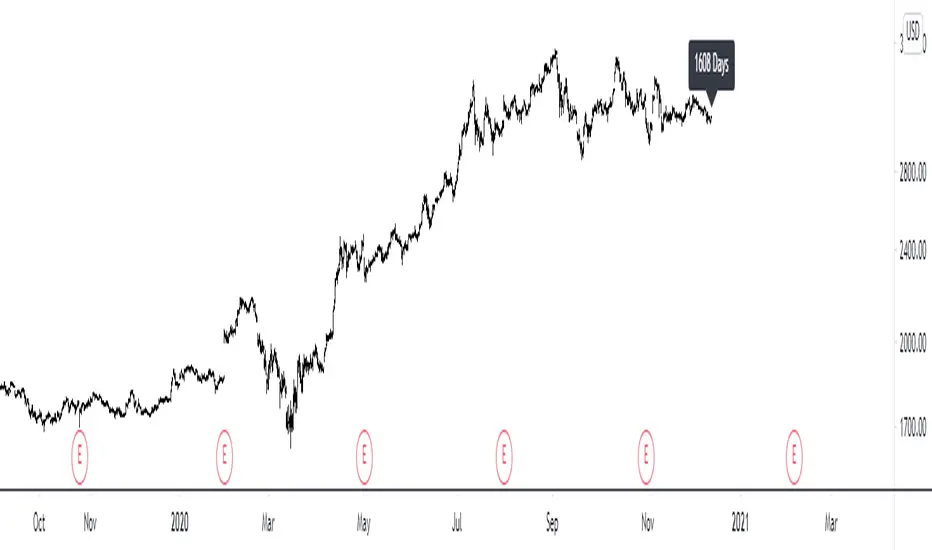
Multi-time-Frame number of days in the chartHelps to see the number of days in any default timeframe chart. (Not yet tested with custom time frames!) Please like and favorite this script if you like it! Any donations of tradingview coins to help me buy a tradingview pro membership would also be highly appreciated! Thank you!Indicador Pine Script®por one-twoActualizado 2245
Volume Bars and Regions of InterestThe bars are colored according to the volume traded. The volume weights were distributed logically for a better analysis. <0.666 low volume 0.666 to 1.333 median volume 1,333 to 2,666 high volume > 2,666 'institutional' volume The moving average bands are the average of the highs and lows. They show a region of interest and not just a 'line'.Indicador Pine Script®por RB_TRADERActualizado 84
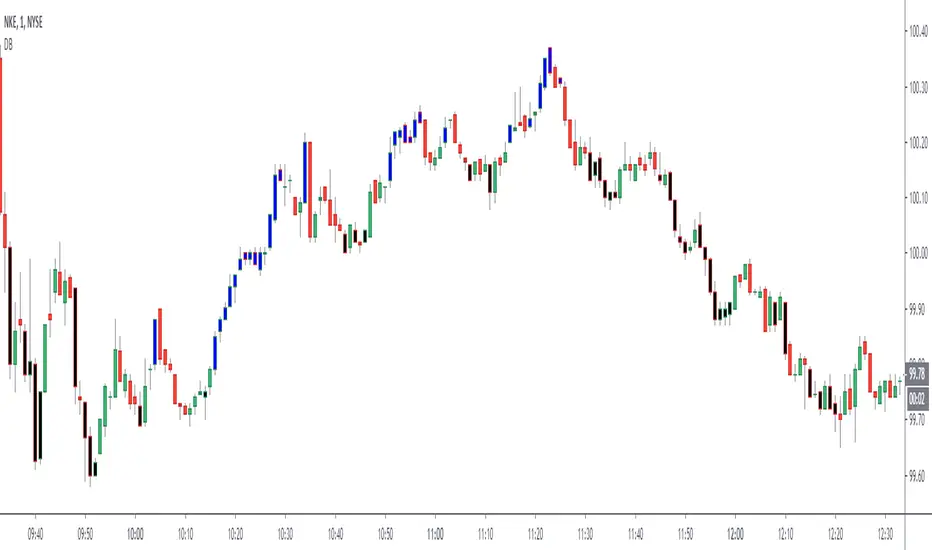
Candles for VSACandles in which the open is equal to the previous close. (For VSA theory) Свечи в которых открытие равно предыдущему закрытию. (Сделано для анализа по ВСА).Indicador Pine Script®por Alex_Dyuk2283
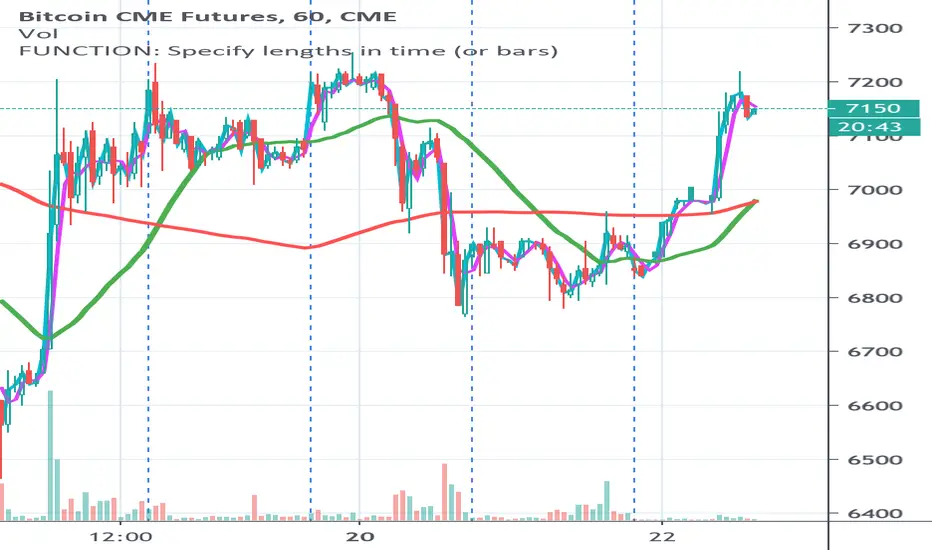
FUNCTION: Specify lengths in time (or bars) This is a function to give measures in time rather than bars... I often want to measure in things in time rather than bars and change the sample rate (the candle size) without reconfiguring my settings. This is a handy function for setting you input lengths in time units (or bars when you want that) For example I want a 3 hour moving average, regardless of whether I have 5 minute candles or 30 min candles... I want a 200 day moving average, regardless of whether I have 1 day or 1 week candles... This is designed for you to put in your own scripts for your own purpose, but you can use this as is for time constant moving averages or as an indicator on an indicator. This shows the same moving averages 45 min / 3 hours in aqua / fuchsia and 1 day / 1 week in red / green First row: On an extended session chart with 10m, 30m and 60m candles (all of them use the same settings (day length is 16 hours) everything else default. Second row: On a standard session chart with 10m, 30m and 60m candles (all of them use the same settings everything else default.Indicador Pine Script®por yatrader2Actualizado 88131
Kaz Style BarsChange bar colors based on above or Below EMA I use it to match Kaz's bars look on my charts Indicador Pine Script®por serverleader22357
Dreadblitz BarsThese bars can give you good opportunities if you know how to analyze the context. blue=bullish black=bearish thumbs upIndicador Pine Script®por Dreadblitz11392
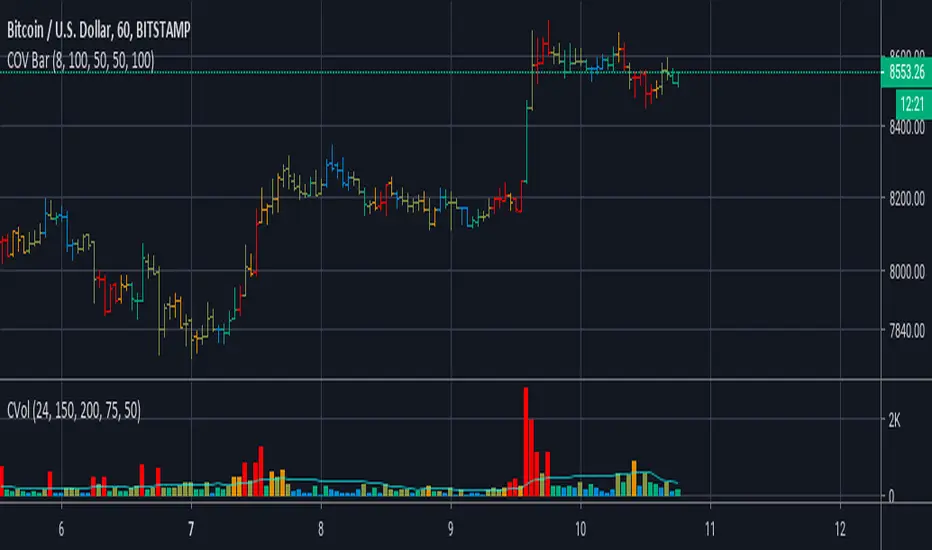
Cumulative Overlapping Volume BarsThis is cheap replacement for volume profile. Red bars is where accumulated high volume in small range. if new bar moves out of range all accumulated volume will be lost and color will change.Indicador Pine Script®por IldarAkhmetgaleev11252
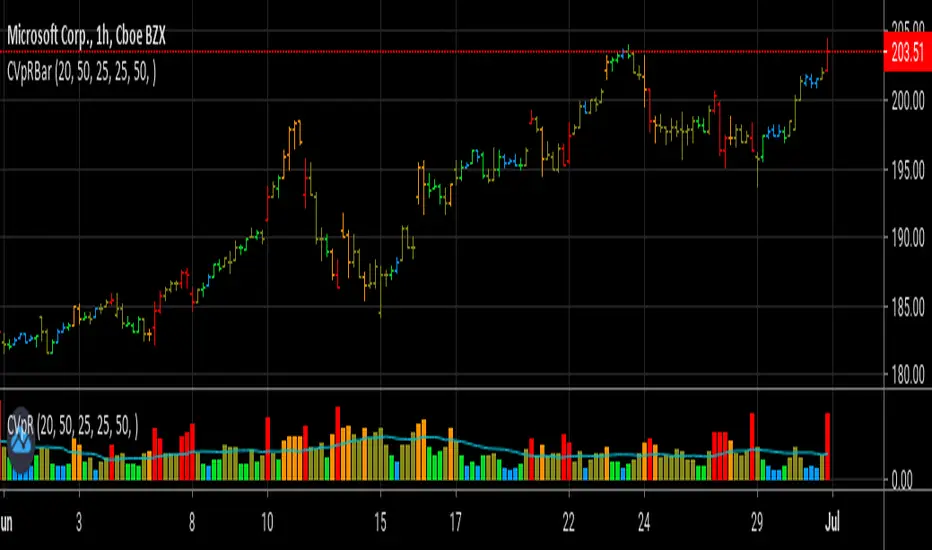
Colored Volume per Range BarsShows relative volume per price range by bar colors.Indicador Pine Script®por IldarAkhmetgaleevActualizado 22244
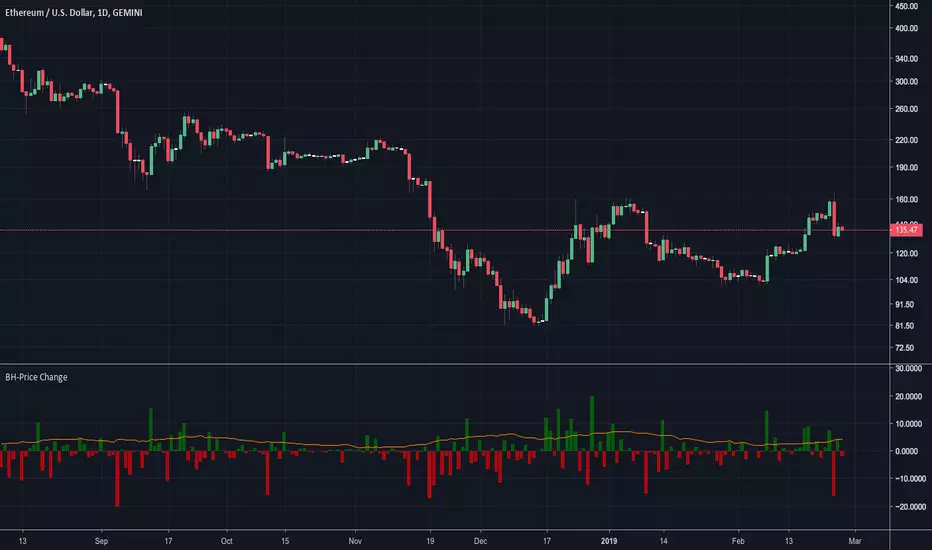
BossHouse - Price ChangeBossHouse - Price Change What it is: In the stock market, a price change is the difference in trading prices from one period to the next or the difference between the daily opening and closing prices of a share of stock. Here you have a timeline with a bar price change. In seconds you can see if the selected market has good and high price changes or not. The values are in percentage and you have a limiter in the settings, so you can show only bar/values above a value. Ex. 2.4%. Why it Matters: Price changes are a core component of financial analysis, and predicting price changes can be as, if not more, important than an actual price change. It is important to remember, however, that percent-based price changes are useful only in the context of the number of dollars involved. A 75% change in the price of a company X, for example, may only involve a few dollars while a 75% change in the price of company Y may involve thousands of dollars. Settings: Show the SMA 21 line Minimum Limit - Set the minimum value to show a bar Calculation: For example, let's say Company XYZ shares opened at $25 this morning and closed at $24. The price change is -$1, or -$1/$25 = -4%. Any help and suggestions will be appreciated. Marcos Issler @ IsslermanIndicador Pine Script®por isslerman44120
candle barsI am trying to count volumes over a period of time. So that turned out awkwardly. Why is it, I do not understand. I did not see anything special about this topic. If someone digs on this topic, I ask for links. Why publish, well, if I take something from the community, I have to return something). Russian himself, so google translation. With zeros do not know on input. By default I enter numbers of candles, like drawsIndicador Pine Script®por chartmen1113
Day of Week BarsHighlights the bars in the specified days of week.Indicador Pine Script®por tradercgtActualizado 44210
SadLittleThings Price Compare With Offset MTF by RRBSadLittleThings Price Compare With Offset MTF by RagingRocketBull 2018 Version 1.0 This indicator lets you compare multiple assets across different timeframes, supports offsets and alpha multipliers. Standard TradingView Compare doesn't have Offset/Timeframe/Multiplier options, hence this indicator. Features: - compare current asset's price with 2 custom ext OHLC sources - plot sources as lines/bars/candles - use offset: - for lines - both positive/negative offsets, unlimited - for bars/candles - only positive offsets <= 5000 - specify timeframe for each source - uses timeframe textbox instead of input resolution dropdown to allow for 240 120 and other custom TFs - support for timeframes in H: H, 2H, 4H etc - show/hide sources - colorize sources - convert source price to 1000s, mlns, or blns using alpha multiplier - total bars counter Notes on using offsets: - Max offset is defined by study max_bars_back which is limited to 5000 for free accounts. This variable specifies the number of history bars an indicator can access. - if you see the 'internal server study error' => one of the indexes of ohlc series is out of bounds (i.e. close ) => decrease the offset <= 5000 or switch to line type - you will be limited only by the total number of bars in history (n) +/- 1 full screen of empty bars - you can't scroll past the beginning of history - 1 empty screen and past the end of history + 1 empty screen to be able to still see the line with applied offset - before applying a large offset, scroll back long enough to make sure you have enough history loaded - if you have a long history the indicator will get slower, its UI less responsive. Reloading the page may fix that. - you will not see source's history past the beginning of the current asset - open the chart with the longest history first (i.e. BLX, not COINBASE) - Make sure that the Left Price Scale shows up with Auto Fit Data enabled. You can reattach the indicator to a different scale in Style. - you may not be able to plot intraday TFs < current TF, because free accounts are limited to TFs >= D1 (i.e. D, 2D, 3D, W), but you can still plot, say, H4+ on a lower TF H1 chart 1. uses plot*, security, change Indicador Pine Script®por RagingRocketBull11111
RSI Bar Colors / ScilentorFeel free to change colors via settings. Indicador Pine Script®por scilentor166
MTF candles by yatrader2Get higher time frame candles overlaid on a lower timeframe chart. Add 1H candles on 1M or 1D on 30M Overlaid candles feature wicks and multiple display options to customize appearance. Add the indicator multiple times to get MTF (multiple time frames) all on one chart. Indicador Pine Script®por yatrader22020 3.7 K
Color Volume Bars [G.Freitas] V 0.1Paints the candlesticks according to its volume levelIndicador Pine Script®por guirf001111155
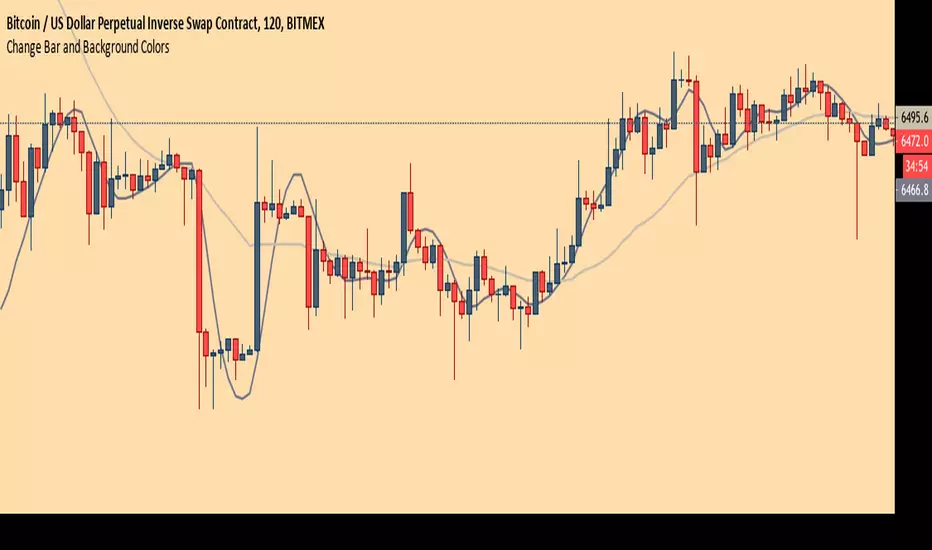
Chart Theme - Change Bar and Background Colors using HEX #sAdds aesthetic ability to charts by allowing the trader to change the color of the bars, background, and plots using HEX colors, rather than TradingView's limited color selector box. This makes for easy application of color palettes to charts. The color palettes can be saved as indicators and applied quickly, as desired.Indicador Pine Script®por savage-s55617
Volume Strength Candles / Colored BarsIs Price Action Higher or Lower on STRONG or WEAK VOLUME from lookback (Strong or Weak Bulls // Strong or Weak Bears) Candles / Bars Indicate the Following (default 13 period lookback / Length) MAROON Bear Candle with STRONG VOLUME more than 150% of the lookback / length (13 default), STRONG Bear Candle Confirmed With Volume RED Bear Candle while VOLUME is BETWEEN 50% & 150% of the Lookback / Length (13 default), Neutral Bear Volume Neither strong or weak ORANGE Bear Candle with WEAK VOLUME (Less than 50% of the Length / Lookback) DARK GREEN Bull Candle with STRONG VOLUME MORE than 150% of lookback GREEN Bull Candle with Neutral VOLUME BETWEEN 50% & 150% of the lookback / Length AQUA Bull Candle with WEAK VOLUME less than 50% of the Lookback Is price confirmed by volume? Can Change the Lookback / Length from 13 Can Change the Colors and Transparency to easily see based off your chart background colors I recommend ZERO Transparency to easily identify volume strength (i use white background but many use black or other) Indicador Pine Script®por stokedstocks44583
Odd Bars Emiliano MesaSimple code which will find and highlight big price movements in a small period of time. This price movements will usually have an opposite reaction of the same size. Use this indicator under your own risk. Emiliano Mesa Indicador Pine Script®por EmilianoMesaActualizado 22
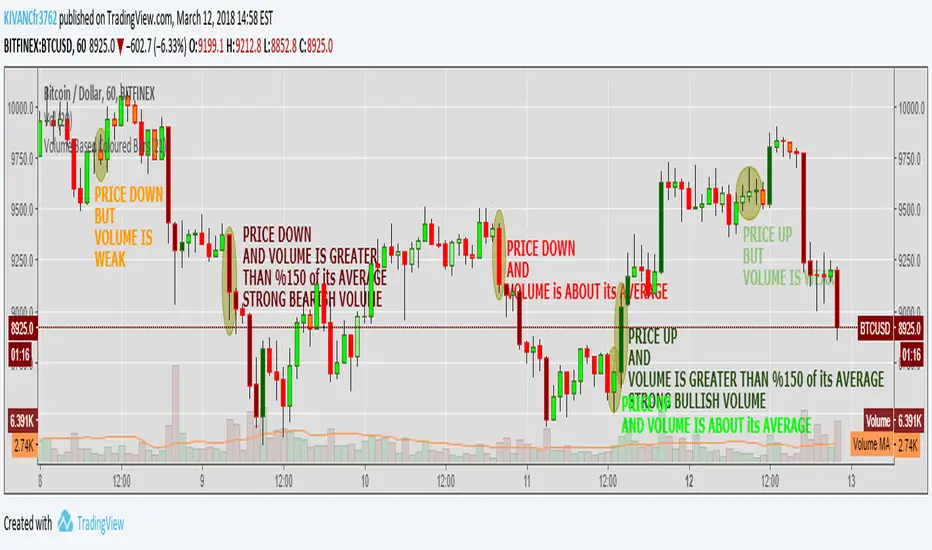
Volume Based Coloured BarsVolume Based Coloured Bars: Most of the time traders are confused about if the price movements were supported by VOLUME . This indicator colors the bars into volume weighted signals... When prices go down bars are red and contraversely when up, bars are green. Additionally we have two more colors for each situation: PRICE BARS ARE: DARK RED when prices go down and VOLUME is bigger than 150% of its (default 21 day) average, that indicates us price action is supported by a strong BEARISH VOLUME RED when prices go down and VOLUME is BETWEEN 50% AND 150% of its (default 21 day) average, at this situation we can think that volume is neither strong nor weak ORANGE when prices go down and VOLUME is just less than 50% of its (default 21 day) average, so the volume is weak and doesn't support the price action much DARK GREEN when prices go UP and VOLUME bigger than 150% of its (default 21 day) average, that indicates us price action is supported by a strong BULLISH VOLUME GREEN when prices go UP and VOLUME is BETWEEN 50% AND 150% of its (default 21 day) average, at this situation we can think that volume is neither strong nor weak LIGHT GREEN when prices go UP and VOLUME is just less than 50% of its (default 21 day) average, so the volume is weak and doesn't support the price action much 21 day Simple Moving Average used as default value which can be changed in the settings menu, 21 day is considered as a month for STOCK Markets, it would be more accurate to set the value to 30 for CRYPTO CURRENCIES Indicador Pine Script®por KivancOzbilgicActualizado 5959 7.3 K
Bollinger BarsA partial implementation of Bollinger Bars, as developed by John Bollinger. This seems to be as close as one can get to true Bollinger Bars with TradingView's current implementation of the Pine language. It may be possible to complete one day. Indicador Pine Script®por optictropicActualizado 2274
Closing bars arrowsSimple script which adds arrows above or below bars. Triangles will appear if close prices is in a above 80% or below 20% of tick price bar. Default values can be changed from settings.Indicador Pine Script®por RomanLosev119