30m Hollow Candle on 5m - SSThis indicator overlays 30-minute candles on a 5-minute chart using clean, hollow-style higher-timeframe (HTF) candles.
The design keeps your chart readable while giving you full insight into the 30m structure that drives intraday price movements.
Each 30-minute candle is drawn as a transparent, hollow outline, so your 5-minute candles remain perfectly visible. The indicator preserves all candle characteristics:
Wicks (high & low)
Open/close levels
Color-coded direction (green = bullish, red = bearish)
Invisible body to avoid overlapping or chart clutter
This tool allows intraday traders to track 30m market structure without constantly switching timeframes.
Bandas y canales

1h Hollow Candle on 5m - SSThis indicator displays 1-hour candles on a 5-minute chart using a clean, minimal visual style designed for intraday traders who want to track higher-timeframe structure without cluttering the chart.
The higher-timeframe (HTF) candles are drawn as hollow outlines, which makes them easy to read while keeping the underlying 5-minute price action fully visible. Each 1-hour candle includes:
Wicks (high & low)
Open/close borders
Color-coded direction (green = bullish, red = bearish)
Transparent body so they never block real candles
This is ideal for traders who want to:
Identify HTF structure during scalping
Spot key reversals inside hourly candles
Track premium/discount zones relative to each 1h candle
Improve top-down analysis without switching timeframes

Asymmetric Market Momentum Channel█ OVERVIEW
"Asymmetric Market Momentum Channel" is a dynamic channel indicator that adjusts its width based on the actual strength and asymmetry of market momentum. Thanks to the asymmetric band expansion triggered by strong candles, it significantly reduces false breakouts while remaining highly sensitive to genuine moves.
█ CONCEPTS
Traditional volatility channels react too slowly or too uniformly. This indicator introduces asymmetry:
- After a strong bullish candle with a large body and long upper wick, the upper band is pushed much farther than the lower one.
- After a strong bearish candle, the lower band expands more.
As a result, the channel "remembers" the direction of the last real momentum.
- With wide bands (default base_scale 200+), it excels in contrarian (reversal) strategies – price tends to return to the midline, producing clean reversal signals.
- With narrow bands (base_scale set to 100–150), it behaves like a sensitive breakout channel – breakouts from a tight channel deliver very high-quality trend-continuation signals.
█ FEATURES
Fully adjustable asymmetric momentum channel:
- length – SMA period for midline and average range (default 30)
- base_scale – base channel width in % of average candle range (default 200%)
- strength – asymmetry intensity (higher = stronger expansion after powerful candles)
- smooth_len – EMA smoothing of the expansion (default 10)
Visualization:
- Upper band – red, lower band – green
- Midline SMA – gray
- Gradient background fill (enabled by default) – red above midline, green below; intensity controlled by Background Intensity (85 = strong, 95 = very subtle)
Signal modes:
- Contrarian (Reversal) – reversal signals on price returning inside the channel after exceeding it + confirming candle color
- Trend Continuation (Breakout) – classic breakout signals (recommended to lower base_scale to 100–150 for faster triggers)
- Both – displays both types simultaneously
Visual signals:
- Small green triangles below the bar → bullish signal
- Small red triangles above the bar → bearish signal
Alerts: Bullish Signal, Bearish Signal, Any Signal, Breakout Up, Breakout Down
█ HOW TO USE
Add the indicator to your TradingView chart and adjust the settings:
Key parameter:
- base_scale – defines the indicator’s character:
→ 200–300% → wide channel → Contrarian (reversal) mode
→ 100–150% → narrow channel → Trend Continuation (breakout) mode
- strength (default 1.0)
- length (30) – higher values = smoother, more trend-following behavior
smooth_len (10) – lower values = faster reaction to new momentum
Interpretation:
- Wide channel (base_scale ≥ 200) + Contrarian mode → mean-reversion trading
- Narrow channel (base_scale 100–150) + Breakout mode → aggressive trend-following on breakouts
- Both mode works universally – simply change base_scale to completely switch the indicator’s behavior
█ APPLICATIONS
- Scalping & daytrading – narrow channel + Breakout mode on 5–15 min
- Swing trading – narrow or wide channel + Both mode on H1–D1
- Mean-reversion – wide channel + Contrarian mode
- Trend filter – longs only above midline, shorts only below
█ NOTES
- In very strong one-sided trends, contrarian signals generate many false entries – switch exclusively to Trend Continuation (Breakout) mode with a narrow channel.
- Best performance on instruments with clear volatility and volume.
- Always match base_scale to your strategy (wide = reversal, narrow = breakout).
- Combining with volume, support/resistance levels, or indicators like MACD/RSI dramatically improves signal quality.

Jace's Range DetectionAttempts to identify when an instrument is trading in a range. It uses Price Movement %, ATR and ADX. The following parameters are configurable: Range Detection Period, Range Threshold(%), ATR Period, ATR Range Multiplier.

Wick-RSI-CandleBody_SEZERthis strategy is ideal to recognize peaks for both long and short positions in 1h and 4h periods. for quick response and faster trade, please use 15m period but keep in mind targeting lower profits. otherwise you may lose your profit.

Directional Imbalance Index [BigBeluga]🔵 OVERVIEW
The Directional Imbalance Index is designed to track market strength by counting how often price sets new highs or lows over a defined lookback period. Every time a bar forms a new extreme, the indicator records a +1 count for either bullish (highs) or bearish (lows). These counts are aggregated into a rolling calculation, allowing traders to see which side dominates and how directional imbalance evolves.
🔵 CONCEPTS
Each new highest high → adds a bullish count (+1).
Each new lowest low → adds a bearish count (+1).
Counts are stored inside arrays over a user-defined Calculation Period .
for i = 0 to period-1
h = high
l = low
if h == upper
countUp.push(1)
if l == lower
countDn.push(1)
The balance between bullish and bearish counts highlights dominance and imbalance.
Normalized percentages help compare both sides (e.g., 65% bullish vs 35% bearish).
🔵 FEATURES
Counts new highs/lows over a chosen Highest/Lowest Length .
Aggregates values over a rolling Calculation Period .
Plots cumulative bullish vs bearish totals in the subchart.
Displays % share of bulls vs bears from total counts.
On-chart labels mark bars where a count was added.
Plots reference lines of the current upper (high) and lower (low) ranges.
Dynamic fill between bullish/bearish plots to visualize which side dominates.
🔵 HOW TO USE
Look for persistent bullish imbalance (bull % > bear %) as confirmation of upward momentum.
Look for persistent bearish imbalance (bear % > bull %) as confirmation of downward momentum.
Watch for shifts in % dominance — often early signs of trend reversal or weakening strength.
Use labels on the chart to visually confirm which bars contributed to directional bias.
Combine with trend or volume tools to confirm whether imbalance aligns with market direction.
🔵 CONCLUSION
The Directional Imbalance Index offers a systematic way to measure directional pressure. By counting how often price pushes into new territory, the indicator reveals whether bulls or bears are taking control. This makes it a valuable tool for detecting early signs of trend continuation or exhaustion, helping traders align with the side most likely to dominate.


Renko 2-block entry, 1-block exit (signals EVERY block)Renko 2-block entry, 1-block exit (signals EVERY block)

Vector CPR Bands## Overview
The Vector CPR Bands indicator enhances the classic Central Pivot Range (CPR) by incorporating "vector" detection—identifying periods with above-average or climactic volume. It projects CPR ranges from these high-volume periods forward as visual bands, which act as persistent support/resistance zones until invalidated by price action. Ideal for spotting key levels in trending or ranging markets, especially on higher timeframes like weekly or monthly.
## Key Features
- **CPR Calculation**: Plots previous, developing (non-repainting), and repainting CPR with mid-pivot, TC (top central), and BC (bottom central) lines, plus fills.
- **Vector Detection**: Scans for high-volume bars in the anchor timeframe (default weekly). Flags "above-average" (≥1.5x avg) or "large" (≥2x avg or max climax).
- **Band Projection**: Creates bands from vector-qualified CPR periods. Extends them rightward until touched/revisited (configurable: invalidate on wick/close, delete or freeze/gray out).
- **Customization**:
- Timeframe: Set CPR anchor (e.g., 'W' for weekly, 'M' for monthly).
- Display: Toggle CPR types, pivot guides.
- Volume Thresholds: Adjust lookback and ratios.
- De-clutter: Limit max bands, pin to period start, always extend.
- **Alerts & Signals**: Built-in alerts for developing pivot crossing previous pivot (bullish/bearish).
## How to Use
1. Add to chart and set anchor timeframe (e.g., 'M' for monthly vCPR on BTC, as shown in example charts).
2. Watch bands as S/R: Virgin (untested) bands often provide strong bounces; mitigated ones fade.
3. Combine with volume/price action: Bullish bands suggest upside bias, especially if price holds above.
4. Example: On BTC weekly, vector bands from high-volume weeks highlight multi-month zones—breaks signal shifts.

Pi Cycle BTC Top + Pre-Alert BandsPi Cycle BTC Top + Pre-Alert Bands is an advanced implementation of the classic Pi Cycle Top model, designed for Bitcoin cycle analysis on higher timeframes (especially 1D BTCUSD/BTCUSD·INDEX).
The original Pi Cycle Top uses two moving averages:
• 111-day SMA (short MA)
• 350-day SMA ×2 (long MA)
A Pi Top is signaled when the 111 SMA crosses above the 350×2 SMA. Historically, this has occurred near major BTC cycle highs.
This script extends that idea with a 3-step early-warning sequence:
• Pi Green – early compression: short/long MA ratio crosses upward into the green band (convergence from below is required).
• Pi Yellow – mid-cycle warning: only fires if a valid Green has already occurred in the same cycle.
• Pi Cycle Top – final top: the classic Pi Cycle cross, limited to one top signal per cycle. After a top, no new Yellow or Top signals can appear until a new Green event starts the next cycle.
Background shading shows the active phase (Green / Yellow / late-cycle zone), so you can see at a glance where BTC is within its Pi-based macro structure.
All logic is non-repainting: request.security() uses lookahead_off and no future data is accessed.
Typical use
This indicator is intended as a macro-cycle timing and risk-awareness tool, not a stand-alone entry system. Many traders use it to:
• Watch for Pi Green as the start of a potential late-cycle advance.
• Treat Pi Yellow as a rising-risk environment and tighten risk management.
• Use the Pi Cycle Top as a historical high-risk zone where large profit-taking or hedging may be considered.
Always combine this with your own analysis (trend, volume, on-chain, macro) before making decisions.
How to set alerts
Add the indicator to your chart (1D BTCUSD or BTCUSD·INDEX recommended).
Click Alerts → Condition → Pi Cycle BTC Top + Pre-Alert Bands.
Choose one of:
• Pi Cycle – Green Pre-Alert (early convergence)
• Pi Cycle – Yellow Pre-Alert (after Green only)
• Pi Cycle – TOP (Single per Cycle, after Green)
Use “Once per bar close” for higher-timeframe reliability.
Disclaimer
This tool is for educational and analytical purposes only. The Pi Cycle concept is based on historical behavior and does not guarantee future results. This is not financial advice; always do your own research and manage risk appropriately.

KC-BB Squeeze Trend Trader█ OVERVIEW
The KC-BB Squeeze Trend Trader identifies volatility compression and expansion by detecting when Bollinger Bands contract inside Keltner Channels and then release with confirmed momentum. It highlights potential trend-starting breakouts by combining squeeze detection, directional momentum, trend bias, and optional volume filters.
During periods of low volatility, price consolidates and energy builds. When volatility expands again, strong directional moves often follow. This tool helps traders spot those opportunities early with clear visual cues and optional performance tracking.
█ KEY FEATURES
Squeeze detection using Bollinger Bands inside Keltner Channels
Automatic identification of volatility expansion after the squeeze ends
Optional filters for momentum, trend direction, volume, and signal cooldown
Dynamic color fills for squeeze, bullish expansion, bearish expansion, and neutral states
Dashboard showing squeeze duration, tightness, momentum, trend, and volume context
Optional win-rate analytics using ATR-based target and stop evaluation
Multi-timeframe confirmation for higher-quality breakouts
█ HOW IT WORKS
A squeeze occurs when both Bollinger Bands sit inside the Keltner Channels.
A breakout begins when the Bollinger Bands expand outside the KCs.
Long signals appear when squeeze release aligns with bullish momentum and trend strength.
Short signals appear when bearish momentum and trend conditions agree.
Volume and cooldown filters help reduce noise and avoid low-quality entries.
█ HOW TO USE
Wait for a squeeze period (yellow fill).
Monitor duration and tightness: longer/tighter squeezes often lead to stronger moves.
When a long or short signal appears, use the plotted ATR-based target and stop as reference levels.
Watch for contraction or exit hints when momentum fades or volatility narrows again.
Higher timeframes generally provide cleaner and more reliable signals.
█ TIMEFRAME GUIDANCE
Crypto: 4H or 1D; consider increasing KC multiplier for high volatility.
Forex: 1H–4H; longer squeeze duration can improve selectivity.
Stocks: 1D–1W; consider slightly higher BB multiplier on slow-moving markets.
█ SETTINGS SUMMARY
Adjustable Bollinger Band and Keltner Channel lengths and multipliers
Three momentum modes: Linear Regression, Price–SMA, or ROC
Trend and volume filters (optional)
Configurable minimum squeeze duration and signal cooldown
ATR-based target and stop multipliers
Optional historically tight squeeze filter (percentile-based)
█ ALERTS
Squeeze Detected
Squeeze Released
Long Entry
Short Entry
Exit Hint
Historically Tight Squeeze
█ NOTES
ATR-based win-rate calculations provide simplified performance estimates.
Past behavior does not guarantee future movement.
Use position sizing and risk management appropriate for the instrument and timeframe.
█ CREDITS
Inspired by the Bollinger Band and Keltner Channel squeeze concept popularized by John Carter’s TTM Squeeze, with added enhancements for squeeze strength, filtering, and real-time performance metrics.

SuperMegaIndicator5000SuperMegaIndicator5000
key levels
ema
volume on price High Vol LowV and chop on price
London open close
vwap
orb
and maybe a couple other indicators

Fibonacci Set-upThe indicator plots Fibonacci retracements based on recent lows and highs.
Additionally it calculates position size, max leverage, max drawdown and pricelevels.
SwiftTrend█ OVERVIEW
SwiftTrend is a trend-following indicator inspired by the classic SuperTrend, but built on a completely different calculation method — using the average candle body size and the body midpoint (bodyMid). It reacts very dynamically to changes in momentum strength. The indicator is clean, easy to read, and perfect for traders who want fast yet confirmed trend direction. By adjusting the settings, you can make signals extremely sensitive or, conversely, reduce their frequency to almost completely eliminate trend flips on minor price moves.
█ CONCEPT
The indicator was created to strike the perfect balance between signal speed and effective noise filtering.
Instead of using classic ATR and price extremes (high/low), SwiftTrend uses the average candle body size and the midpoint of the previous candle’s body as its core reference. The dynamic trend line (avgLine) is protected by a tolerance zone – the trend only changes after price closes beyond this zone. This approach delivers significantly faster reaction times than many traditional solutions while maintaining excellent resistance to false signals during ranging markets.
█ FEATURES
Data source:
- Average candle body size: SMA(|open – close|, period)
- Reference point: midpoint of the previous candle’s body (bodyMid )
Dynamic trend line (avgLine):
- Built using Band Multiplier
- The line is “attracted” toward price movement
Tolerance zone (margin):
- Tolerance = Tolerance Multiplier × avgBody
- Default: 2.5 (for both band and tolerance)
Trend change logic:
- Down → Up: close > avgLine + tolerance
- Up → Down: close < avgLine – tolerance
Visual signals:
- “Buy” label (green upward arrow) and “Sell” label (red downward arrow) only on confirmed trend change
- Optional soft gradient fill between trend line and price
- Optional bar coloring based on current trend
- Trend line with breaks at reversal points
Alerts:
- Buy alert – triggers only when the closing price crosses from below to above the marginLineBase
- Sell alert – triggers only when the closing price crosses from above to below the marginLineBase
█ HOW TO USE
Add to chart → paste the code in Pine Editor or search for “SwiftTrend”.
Main settings:
- Average Body Periods → default 100
- Band Multiplier → default 2.5
- Tolerance Multiplier → default 2.5 (key sensitivity parameter)
- Colors, fill, and bar coloring – fully customizable
Interpretation:
- Green line & shading = uptrend
- Red line & shading = downtrend
- Higher Tolerance Multiplier = fewer but higher-quality signals
- Tolerance Multiplier near 0 = ultra-fast signals (aggressive mode)
█ APPLICATIONS
Excellent for:
- Trend-following (enter with trend, exit on reversal)
- Breakout and momentum strategies
- Filtering consolidation and noise – thanks to the adjustable tolerance zone
Best combined with:
- Classic support/resistance levels
- Fibonacci retracements, Pivot Points, psychological round numbers
- Confirmation from oscillators (RSI, Stochastic, MACD)
- Volume or volume profile analysis
Style adaptation:
- Scalping / daytrading → lower Tolerance Multiplier (0.8–1.8) + shorter period
- Swing / position trading → higher values (2.5–5.0) + longer period
█ NOTES
- Works on all markets and timeframes
- Success depends on matching the Tolerance Multiplier to your strategy and the instrument’s volatility
- Higher multiplier & period values = fewer signals, significantly higher quality
- At Tolerance Multiplier = 0 the indicator becomes extremely responsive – perfect for aggressive momentum trading

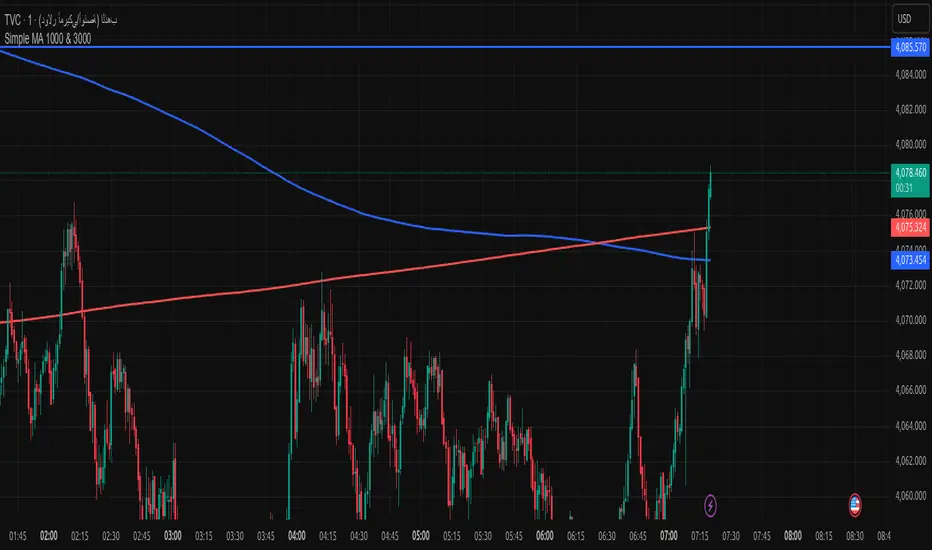
Simple MA 1000 & 3000when toche moving address add buy if from high or sell if from donw with sl 20pip
Global M2 Money Supply (100+ countries, USD, Offset)Global M2 Money Supply:
-potentially 100+ countries - countries can be added in Script,
-USD, Offset
-offset in months can be manually adjusted to account for the time that i takes for liquidity to hit the market

Multi-Timeframe Stochastic (4x) z Podświetlaniem - PawelA script that provides information when most of the stocks are in the overbought or oversold zone.

Multi-Timeframe RSI (4x) z Podświetlaniem - PawełRSI z podświetleniem z różnych tfów z ustawianiem intensywnosci i kolorów.

darshakssc SMC Infinity Enginedarshakssc SMC Infinity Engine is an advanced Smart Money Concepts–based tool designed to help traders visually understand institutional price behavior such as liquidity sweeps, displacement moves, and structure breaks — all without repainting.
This script does not predict the future or guarantee outcomes.
Instead, it provides a structured price-action framework to help traders study how markets move during key intraday phases.
🔍 Core Concepts Used
This indicator highlights:
Liquidity Sweeps (equal highs/lows taken out)
Displacement Candles (strong institutional momentum bars)
Break of Structure (BOS) confirmations
Kill Zone Sessions (optional smart-money timing filter)
Higher Time Frame Trend Alignment
Dynamic Entry, Stop Loss, and Target Levels
Internal trade outcome tagging (TP1/TP2/TP3/SL)
These components are widely used in institutional price-action models and can help users understand how liquidity and structure interact throughout the trading day.
📊 What the Indicator Displays
LONG / SHORT signals after confirmed BOS
Entry, SL, TP1, TP2, TP3 mapped directly on the chart
Background highlighting for liquidity sweep zones
A clean dashboard showing:
Current symbol
Current price
Number of setups recognized
TP1/TP2/TP3 stats
SL count
Live win-rate calculation
Last outcome recorded
All visuals are provided for study purposes to help users review how price reacts during key structure shifts.
🧠 How to Use It (Educational Purpose)
This tool is designed as a market research & educational study aid.
You can use it to:
Observe how liquidity sweeps often precede directional moves
Study how displacement confirms institutional intent
Analyze BOS-based structure shifts
Compare HTF trend alignment with LTF execution
Review trade outcomes historically for self-improvement
It can assist in building discipline and consistency when learning SMC-style concepts — without any automation or strategy execution.
⚠️ Important Notes
This script does not repaint.
This is not a trading system, signal generator, or financial advice.
All information is for educational and informational purposes only.
Past performance does not guarantee future results.
Users should always perform their own analysis and risk management.
🛡️ Compliance Disclaimer
This script is provided for educational purposes only.
It does not constitute investment advice, does not guarantee results, and should not be used as the sole basis for any trading decision.

Simple VP Shape DetectorSimple VP Shape Detector is a lightweight Pine Script tool designed to help traders quickly identify the four major Volume Profile shapes commonly used in orderflow and auction-market theory:
D-Shape (Balanced Profile)
P-Shape (Short-Covering / Buyer-Dominant)
B-Shape (Long-Liquidation / Seller-Dominant)
Thin Profile (Trend Profile)
This indicator uses candle statistics (range, body size, volume distribution approximation, and directional movement) to estimate the underlying shape of the volume profile when the full Volume Profile tool is not available.
✔️ What this indicator does
Analyzes recent bars to estimate volume concentration vs. price movement
Flags possible VP shapes using simple logic
Displays labels above/below candles showing:
“D” → Balanced
“P” → Buyer-heavy
“B” → Seller-heavy
“T” → Trending / Thin profile
Helps traders quickly identify auction conditions
✔️ Why this is useful
Volume Profile tools require premium data or heavy visual processing.
This script provides a simple, fast, CPU-light alternative that still captures the essential behavior of profile shapes.
✔️ How shapes are detected
D-Shape: small directional movement + larger body clustering
P-Shape: strong upward move + volume weighted to upper half
B-Shape: strong downward move + volume weighted to lower half
Thin: long range candles with little internal consolidation
⚠️ Disclaimer
This script is an approximation. It does NOT replace full Volume Profile tools.
It is designed as an educational / supplemental tool for market structure analysis.

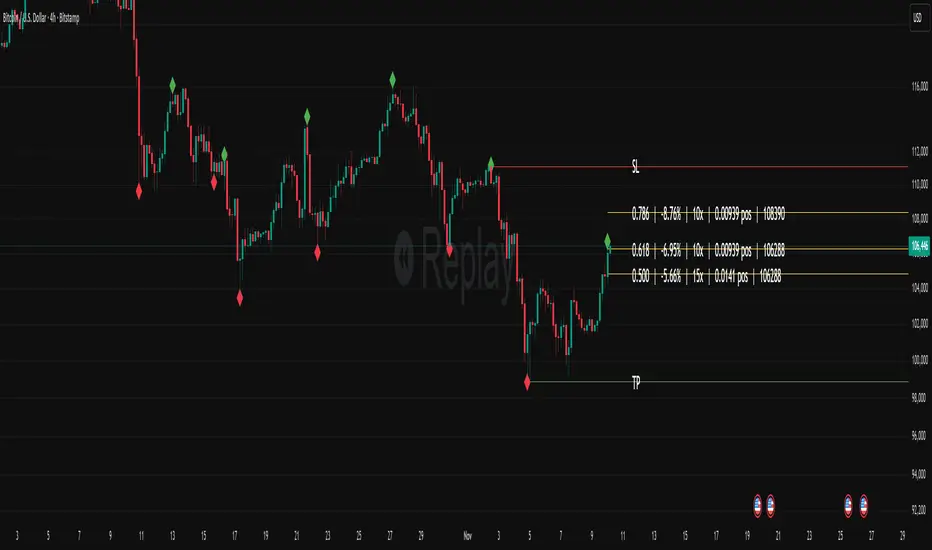
ATR STRUCTURE
So I can produce this
🟡 START = 662.63 ✳️ ATR ≈ 8.30 pts (0.5 ATR ≈ 4.15 • 1 ATR ≈ 8.30) 🙂📏
ATR bands (numeric)
🔼 START + 0.5 ATR = 662.63 + 4.15 = 666.78 (upper buffer / shelf)
🔼 START + 1 ATR = 662.63 + 8.30 = 670.93 (breakout band)
🔽 START − 0.5 ATR = 662.63 − 4.15 = 658.48 (near support)
🔽 START − 1 ATR = 662.63 − 8.30 = 654.33 (deeper stop zone)
— Priority level ladder (footprint‑first & ATR alignment) — (emoji = confidence • 🔥 = high • ✅ = footprint confirmed • 🟡 = medium)
🔥🟢 PM_LOW / D1 — ~659.95 → 660.50 ✅ (FOOTPRINT CONFIRMED)
Why: repeated 30m+1h absorption (sold‑into then bought up). DEEP confidence. 🧯🔁
🔥🔴 ORBH / U2 cluster — ~663.98 → 665.87 ✅ (FOOTPRINT SUPPLY)
Why: repeated rejections / sell MaxDelta rows on 30m & 1h. Treat as overhead supply / shelf. 🪓📉
🔥🟦 D3 / ORBL corridor — ~658.64 ✅ (TF confluence: 1h+4h MaxDelta)
Why: single‑row institutional sells map here; structural LVN / open‑range low. 🛡️📌
🟡⭐ START / U1 pivot zone — ~662.63 – 662.70 ✅ (session pivot, 1h absorption)
Why: session magnet—use for intraday bias pivot / quick confirms. 👀⚖️
🟡🔥 U4 / U5 upper HVN band — ~666.7 → 669.3 (ATR UPPER)
Why: strong HVN / stop‑run evidence on higher TFs — needs large buy MaxDelta to flip. 🚧🚀
⚪ D5 lower expansion support — ~654.3–656.7 (deeper target if sellers run)
Why: longer‑TF expansion area; lower immediate probability but high impact if hit. ⚠️📉

FxAST Ichi ProSeries Enhanced Full Market Regime EngineFxAST Ichi ProSeries v1.x is a modernized Ichimoku engine that keeps the classic logic but adds a full market regime engine for any market and instrument.”
Multi-timeframe cloud overlay
Oracle long-term baseline
Trend regime classifier (Bull / Bear / Transition / Range)
Chikou & Cloud breakout signals
HTF + Oracle + Trend dashboard
Alert-ready structure for automation
No repainting: all HTF calls use lookahead_off.
1. Core Ichimoku Engine
Code sections:
Input group: Core Ichimoku
Function: ichiCalc()
Variables: tenkan, kijun, spanA, spanB, chikou
What it does
Calculates the classic Ichimoku components:
Tenkan (Conversion Line) – fast Donchian average (convLen)
Kijun (Base Line) – slower Donchian average (baseLen)
Senkou Span A (Span A / Lead1) – (Tenkan + Kijun)/2
Senkou Span B (Span B / Lead2) – Donchian over spanBLen
Chikou – current close shifted back in time (displace)
Everything else in the indicator builds on this engine.
How to use it (trading)
Tenkan vs Kijun = short-term vs medium-term balance.
Tenkan above Kijun = short-term bullish control; below = bearish control.
Span A / B defines the cloud, which represents equilibrium and support/resistance.
Price above cloud = bullish bias; price below cloud = bearish bias.
Graphic
2. Display & Cloud Styling
Code sections:
Input groups: Display Options, Cloud Styling, Lagging Span & Signals
Variables: showTenkan, showKijun, showChikou, showCloud, bullCloudColor, bearCloudColor, cloudLineWidth, laggingColor
Plots: plot(tenkan), plot(kijun), plot(chikou), p1, p2, fill(p1, p2, ...)
What it does
Lets you toggle individual components:
Show/hide Tenkan, Kijun, Chikou, and the cloud.
Customize cloud colors & opacity:
bullCloudColor when Span A > Span B
bearCloudColor when Span A < Span B
Adjust cloud line width for clarity.
How to use it
Turn off components you don’t use (e.g., hide Chikou if you only want cloud + Tenkan/Kijun).
For higher-timeframe or noisy charts, use thicker Kijun & cloud so structure is easier to see.
Graphic
Before
After
3. HTF Cloud Overlay (Multi-Timeframe)
Code sections:
Input group: HTF Cloud Overlay
Vars: showHTFCloud, htfTf, htfAlpha
Logic: request.security(..., ichiCalc(...)) → htfSpanA, htfSpanB
Plots: pHTF1, pHTF2, fill(pHTF1, pHTF2, ...)
What it does
Pulls higher-timeframe Ichimoku cloud (e.g., 1H, 4H, Daily) onto your current chart.
Uses the same Ichimoku settings but aggregates on htfTf.
Plots an extra, semi-transparent cloud ahead of price:
Greenish when HTF Span A > Span B
Reddish when HTF Span B > Span A
How to use it
Trade LTF (e.g., 5m/15m) only in alignment with HTF trend:
HTF cloud bullish + LTF Ichi bullish → look for longs
HTF cloud bearish + LTF Ichi bearish → look for shorts
Treat HTF cloud boundaries as major S/R zones.
Graphic
4. Oracle Module
Code sections:
Input group: Oracle Module
Vars: useOracle, oracleLen, oracleColor, oracleWidth, oracleSlopeLen
Logic: oracleLine = donchian(oracleLen); slope check vs oracleLine
Plot: plot(useOracle ? oracleLine : na, "Oracle", ...)
What it does
Creates a long-term Donchian baseline (default 208 bars).
Uses a simple slope check:
Current Oracle > Oracle oracleSlopeLen bars ago → Oracle Bull
Current Oracle < Oracle oracleSlopeLen bars ago → Oracle Bear
Slope state is also shown in the dashboard (“Bull / Bear / Flat”).
How to use it
Think of Oracle as your macro anchor :
Only take longs when Oracle is sloping up or flat.
Only take shorts when Oracle is sloping down or flat.
Works well combined with HTF cloud:
HTF cloud bullish + Oracle Bull = higher conviction long bias.
Ideal for Gold / Indices swing trades as a trend filter.
Graphic idea
5. Trend Regime Classifier
Code sections:
Input group: Trend Regime Logic
Vars: useTrendRegime, bgTrendOpacity, minTrendScore
Logic:
priceAboveCloud, priceBelowCloud, priceInsideCloud
Tenkan vs Kijun alignment
Cloud bullish/bearish
bullScore / bearScore (0–3)
regime + regimeLabel + regimeColor
Visuals: bgcolor(regimeColor) and optional barcolor() in priceColoring mode.
What it does
Scores the market in three dimensions :
Price vs Cloud
Tenkan vs Kijun
Cloud Direction (Span A vs Span B)
Each condition contributes +1 to either bullScore or bearScore .
Then:
Bull regime when:
bullScore >= minTrendScore and bullScore > bearScore
Price in cloud → “Range”
Everything else → “Transition”
These regimes are shown as:
Background colors:
Teal = Bull
Maroon = Bear
Orange = Range
Silver = Transition
Optional candle recoloring when priceColoring = true.
How to use it
Filters:
Only buy when regime = Bull or Transition and Oracle/HTF agree.
Only sell when regime = Bear or Transition and Oracle/HTF agree.
No trade zone:
When regime = Range (price inside cloud), avoid new entries; wait for break.
Aggressiveness:
Adjust minTrendScore to be stricter (3) or looser (1).
Graphic
6. Signals: Chikou & Cloud Breakout
Code sections :
Logic:
chikouBuySignal = ta.crossover(chikou, close)
chikouSellSignal = ta.crossunder(chikou, close)
cloudBreakUp = priceInsideCloud and priceAboveCloud
cloudBreakDown = priceInsideCloud and priceBelowCloud
What it does
1. Two key signal groups:
Chikou Cross Signals
Buy when Chikou crosses up through price.
Sell when Chikou crosses down through price.
Classic Ichi confirmation idea: Chikou breaking free of price cluster.
2. Cloud Breakout Signals
Long trigger: yesterday inside cloud → today price breaks above cloud.
Short trigger: yesterday inside cloud → today price breaks below cloud.
Captures “equilibrium → expansion” moves.
These are conditions only in this version (no chart shapes yet) but are fully wired for alerts. (Future Updates)
How to use it
Use Chikou signals as confirmation, not standalone entries:
Eg., Bull regime + Oracle Bull + cloud breakout + Chikou Buy.
Use Cloud Breakouts to catch the first impulsive leg after consolidation.
Graphic
7. Alerts (Automation Ready)
[
b]Code sections:
Input group: Alerts
Vars: useAlertTrend, useAlertChikou, useAlertCloudBO
Alert lines like: "FxAST Ichi Bull Trend", "FxAST Ichi Bull Trend", "FxAST Ichi Cloud Break Up"
What it does
Provides ready-made alert hooks for:
Trend regime (Bull / Bear)
Chikou cross buy/sell
Cloud breakout up/down
Each type can be globally toggled on/off via the inputs (helpful if a user only wants one kind).
How to use it
In TradingView: set alerts using “Any alert() function call” on this indicator.
Then filter which ones fire by:
Turning specific alert toggles on/off in input panel, or
Filtering text in your external bot / webhook side.
Example simple workflow ---> Indicator ---> TV Alert ---> Webhook ---> Bot/Broker
8. FxAST Dashboard
Code sections:
Input group: Dashboard
Vars: showDashboard, dashPos, dash, dashInit
Helper: getDashPos() → position.*
Table cells (updated on barstate.islast):
Row 0: Regime + label
Row 1: Oracle status (Bull / Bear / Flat / Off)
Row 2: HTF Cloud (On + TF / Off)
Row 3: Scores (BullScore / BearScore)
What it does
Displays a compact panel with the state of the whole system :
Current Trend Regime (Bull / Bear / Transition / Range)
Oracle slope state
Whether HTF Cloud is active + which timeframe
Raw Bull / Bear scores (0–3 each)
Position can be set: Top Right, Top Left, Bottom Right, Bottom Left.
How to use it
Treat it like a pilot instrument cluster :
Quick glance: “Are my trend, oracle and HTF all aligned?”
Great for streaming / screenshots: everything important is visible in one place without reading the code.
Graphic (lower right of chart )

Advanced Linear Regression Pro [PointAlgo]Advanced Linear Regression Pro is an open-source tool designed to visualize market structure using linear regression, volatility bands, and optional volume-weighted calculations.
The indicator expands the concept of regression channels by adding higher-timeframe confluence, slope analysis, imbalance detection, and breakout highlighting.
Key Features
• Volume-Weighted Regression
Weights the regression curve based on volume to highlight periods of strong participation.
• Dynamic Standard-Deviation Bands
Upper and lower bands are derived from volatility to help visualize potential expansion or contraction zones.
• Multi-Timeframe (MTF) Regression
Plots higher-timeframe regression lines and bands for additional trend context.
• Slope Strength Analysis
Helps identify whether the current regression slope is trending upward, downward, or in a neutral range.
• Order Flow Imbalance Detection
Highlights bars where price and volume move unusually fast, which may indicate liquidity voids or imbalance zones.
• Breakout Markers
Shows simple visual markers when the price closes beyond volatility bands with volume confirmation.
These are visual signals only, not trading signals.
How to Use
This indicator is meant for visual market analysis, such as:
Observing trend direction through regression slope
Spotting volatility expansions
Comparing price against higher-timeframe regression structure
Identifying areas where price moves rapidly with volume
It can be used on any market or timeframe.
No part of this script is intended as financial advice or a complete trading system.
