Magic Moving Averages!Magic Moving Averages! is an indicator that comes standard in many forex trading platforms, and now on Tradingview designed for comfortable readability! It incorporates a series of simple moving averages plotted together with increasing periods. Finding a good trade with this is easily found with a set of rules. I took a course with Alex du Plooy on these rules and am using his suggested default values, however there are many more teachers of this method that have various rules that may be similar. If you desire a greater MA spread simply increase the MA Separation value in the input. Best for 15 mins or longer charts.
Happy trading
Averages
Super Guppy MMA [MFWIC]I compiled the new and improved Guppy Multiple Moving Averages. Hope it has some value. Plan your trade and trade your plan!

Easy Multiple Moving AveragesFor easy one on/off clicking. Don't waste your time clicking multiple times.

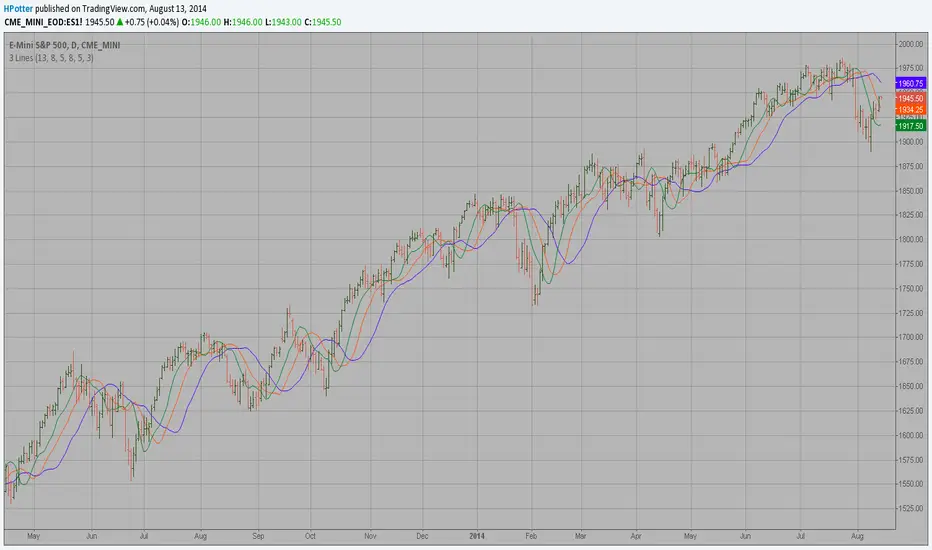
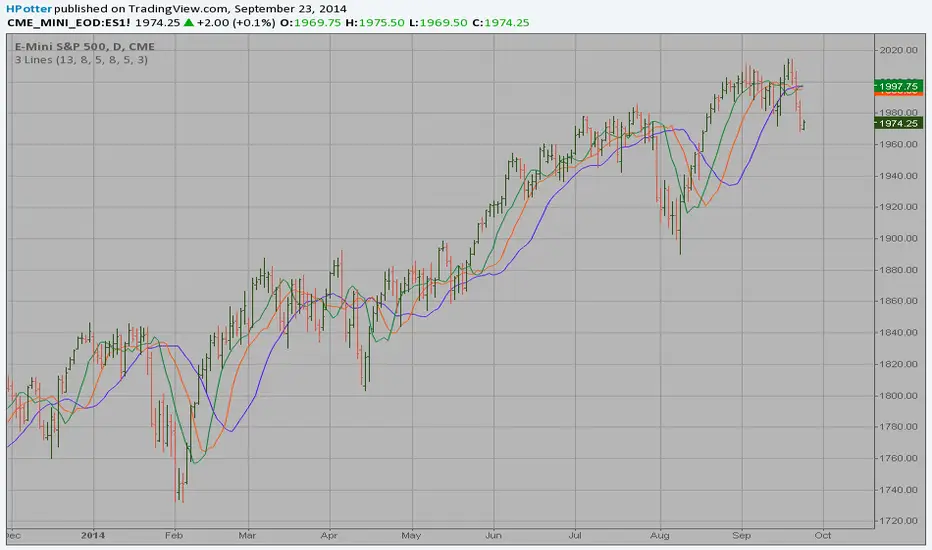
Bill Williams Averages. 3Lines Backtest This indicator calculates 3 Moving Averages for default values of
13, 8 and 5 days, with displacement 8, 5 and 3 days: Median Price (High+Low/2).
The most popular method of interpreting a moving average is to compare
the relationship between a moving average of the security's price with
the security's price itself (or between several moving averages).

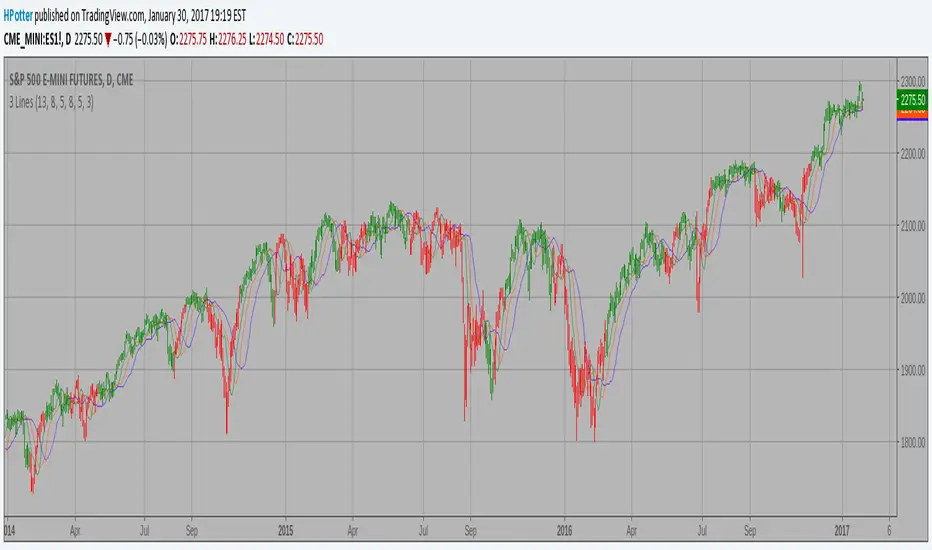
Bill Williams Averages. 3Lines Strategy This indicator calculates 3 Moving Averages for default values of
13, 8 and 5 days, with displacement 8, 5 and 3 days: Median Price (High+Low/2).
The most popular method of interpreting a moving average is to compare
the relationship between a moving average of the security's price with
the security's price itself (or between several moving averages).
Bill Williams Averages SMMA This indicator calculates 3 Smoothed moving average for default values of
13, 8 and 5 days, with displacement 8, 5 and 3 days.
The most popular method of interpreting a moving average is to compare
the relationship between a moving average of the security's price with
the security's price itself (or between several moving averages).
Bill Williams Averages This indicator calculates 3 Moving Averages for default values of
13, 8 and 5 days, with displacement 8, 5 and 3 days: Median Price (High+Low/2).
The most popular method of interpreting a moving average is to compare
the relationship between a moving average of the security's price with
the security's price itself (or between several moving averages).