ADR Nivele Horizontale dhe EMAThe user provided a Pine Script code for an indicator called "ADR Nivele Horizontale dhe EMA". The task is to explain how this code works. Hmm, first, I need to understand what this indicator does. The title mentions ADR levels and EMA, so it's probably combining horizontal lines based on Average Daily Range and some Exponential Moving Averages.
Looking at the code, the first part is the indicator declaration with version 6. The settings include an ADR period, levels above and below the mid, and line style. Then there's a section for calculations. They request daily high and low to compute the daily range. The ADR is the SMA of the daily range over the specified period. The mid is the average of daily high and low. The adr_val is half of ADR, maybe to create symmetrical levels around the mid.
Next, they create arrays for lines and labels above and below the mid. The loops go from 1 to levels_above/below, calculate each level, draw lines and labels. The mid line is also drawn with a different color. Then, there are several EMAs plotted: 13, 50, 200, 400, 600, 800, each with different colorsWait, but in Pine Script, when you use arrays to store lines and labels, you have to manage them properly to avoid repainting or memory issues. The code uses array.concat to add new lines and labels each bar. However, since this code is running on each bar, the for loops might be creating multiple lines each time, leading to too many objects. Oh right, but they use var to initialize the arrays, so they are only initialized once. Wait, no. The var keyword initializes the variable once, but in each iteration, they are concatenating new lines. Wait, no: the for loops are inside the main script, which runs on each bar. So every time a new bar is processed, the loops will run again, adding new lines and labels. That's a problem because each bar would create new lines, leading to an ever-increasing number of lines, which could hit the maximum limit (max_lines_count is set to 20, but maybe they have more bars). Oh, the indicator has max_lines_count=20, but the code might be creating multiple lines per bar. So maybe the code isn't handling the line management correctly. For example, if levels_above is 2, then each bar would create 2 new lines above and 2 below, plus the mid line. Over 20 bars, that's way over 20 lines. So this could cause the indicator to stop drawing after 20 lines. The user might not have realized that the lines are being recreated every bar, leading to a buildup. But perhaps the original code intended to have the lines update each bar, extending to the current bar. Let's see: in line.new, they use bar_index as the starting x1 and bar_index as x2. So each line is drawn from the previous bar's index to the current one. But since this is done on every bar, each line is only one bar long. Wait, no. Because on each new bar, the code creates a new line from the previous bar's index (bar_index , which is now the bar before the current one) to the current bar_index. So each line is just a segment from the previous bar to the current bar. But when the next bar comes, a new line is created again. So the result is that each level line is a series of one-bar-length segments, which might not be intended. The user probably wants continuous lines that extend from the left to the right, not just per bar. So this approach is incorrect. The correct way would be to have a line that starts at the first bar of the calculation and extends to the right, updating each bar. But the current code creates a new line each bar, leading to multiple short lines instead of one continuous line. That's a mistake.
So the main issue here is that the code is generating a new line segment for each bar, which is not efficient and would quickly hit the line limit. To fix this, instead of creating a new line every bar, they should create the line once and then update its position each bar. But in Pine Script, you can't directly update a line after it's created; instead, you need to track the line ID and use line.set_xy() to extend it. However, the current code uses array.concat to add new lines each bar, which isn't the right approach.
Therefore, the code as written will create multiple short lines instead of continuous horizontal lines. The correct approach for horizontal levels that extend to the right is to create the line once, starting at a certain bar and extending indefinitely, or to update the line's end point each new bar. But in Pine Script, you can't extend lines infinitely; you have to manage them each bar. Alternatively, using the 'line.extend' style might help, but I think the original code's logic is flawed here.
Additionally, the EMA part is straightforward: plotting multiple EMAs with different periods. That part should work as expected.
So the explanation should mention that the ADR levels are calculated based on the daily high and low, then the code attempts to draw horizontal lines above and below the mid-point. However, the way the lines are drawn may lead to multiple short segments instead of continuous lines, potentially causing performance issues or hitting the maximum line count. The EMAs are plotted correctly with various periods..
ADR

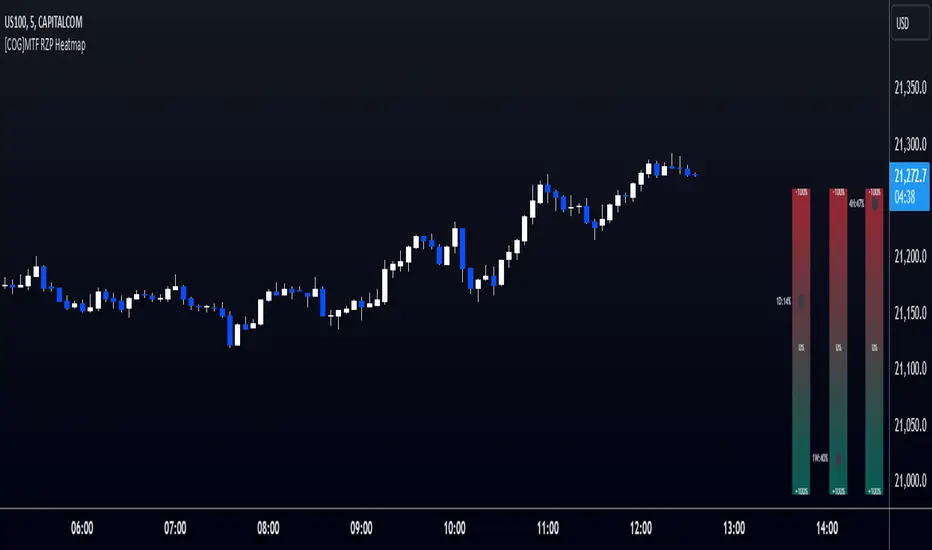
[COG]MTF RZP Heatmap MTF RZP Heatmap (Range Zone Pulse)
What It Does
This indicator creates three visual heatmaps that show how current price movement compares to the average range of different timeframes. It helps traders:
Identify when price moves are overextended
Compare momentum across different timeframes
Spot potential reversal points
Understand the relative strength of price movements
How It Works
Range Calculation:
For each selected timeframe, it calculates an average range based on the specified number of periods
The range is measured from high to low for each period
A moving average of these ranges creates a dynamic "normal" range for that timeframe
Position Calculation:
Measures how far price has moved from the period's opening price
Compares this movement to the average range
Converts the movement into a percentage (-100% to +100%)
Visual Display:
Shows three vertical heatmaps, one for each timeframe
Colors graduate from bearish (typically red) to bullish (typically green)
A dot indicator shows the current position within each range
Percentage labels show exact movement relative to average range
Trading Applications
Trend Trading:
Multiple timeframes aligned in the same color suggest strong trend
Use larger timeframes (Daily/Weekly) for trend direction
Use smaller timeframes (4H/1H) for entry timing
Mean Reversion:
Extreme readings (near +100% or -100%) suggest overextended moves
Look for divergences between timeframes
Use when shorter timeframes show extremes but larger timeframes don't
Volatility Trading:
Compare current moves to average ranges
Identify when markets are more volatile than usual
Adjust position sizes based on range expansion/contraction
Multi-Timeframe Analysis:
Compare price action across different time horizons
Identify conflicting signals between timeframes
Use for timeframe alignment in trading decisions
Best Practices for Usage
Timeframe Selection:
Set the first timeframe to your trading timeframe
Set the second timeframe to your trend timeframe
Set the third timeframe to your entry timeframe
Range Period Settings:
Default is 5 periods
Increase for more stable readings
Decrease for more responsive readings
Color Interpretation:
Darker colors indicate stronger moves
Look for alignment across timeframes
Watch for extremes in any timeframe
Trading Setups:
Wait for alignment in multiple timeframes
Use extreme readings for counter-trend trades
Combine with other indicators for confirmation
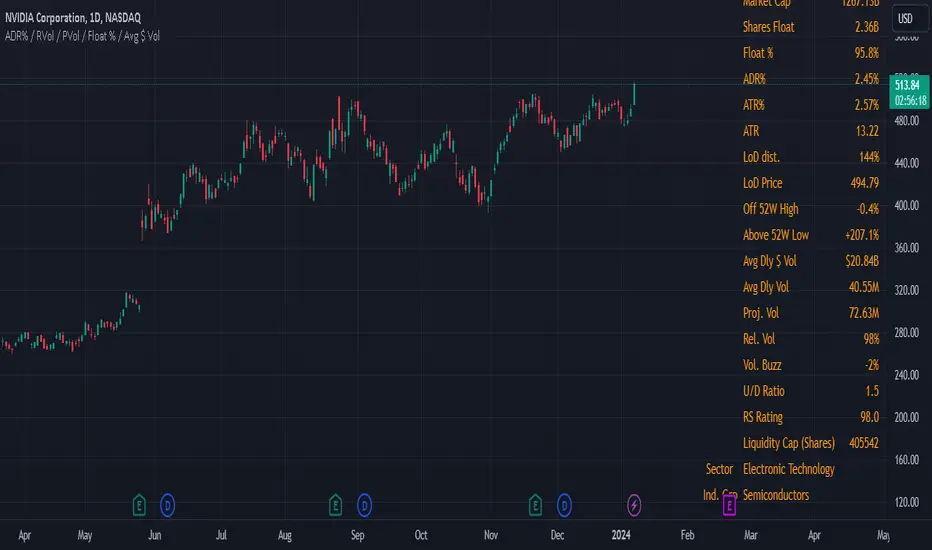
Comprehensive Volume and Metrics with Pre-Market Volume Data
This script is designed for traders who want a detailed view of market activity, including regular market and pre-market volume, dollar volume, relative volume (RVOL), average daily range (ADR), average true range (ATR), relative strength index (RSI), and the QQQ’s percentage change.
The script includes customizable metrics displayed in tables on the chart for easy analysis, with the option to toggle the visibility of each metric.
Key Features:
Volume and Dollar Volume:
Displays the volume of shares traded during the current day (or pre-market, if enabled).
Includes a calculation of dollar volume, representing the total dollar amount of trades (Volume × Close Price).
Relative Volume (RVOL):
Displays RVOL Day, which is the relative volume of the current day compared to the 2-day moving average.
Shows RVOL 90D, indicating relative volume over the past 90 days.
Both RVOL metrics are calculated as percentages and display the percentage change compared to the standard (100%).
Pre-Market Data:
Includes pre-market volume (PVOL) and pre-market dollar volume (P$ VOL) which are displayed only if pre-market data is enabled.
Tracks volume and dollar volume during pre-market hours (4:00 AM to 9:30 AM Eastern Time) for more in-depth analysis.
Optionally, shows pre-market RSI based on volume-weighted close prices.
Average Daily Range (ADR):
Displays the percentage change between the highest and lowest prices over the defined ADR period (default is 20 days).
Average True Range (ATR):
Shows the ATR, a popular volatility indicator, for a given period (default is 14 bars).
RSI (Relative Strength Index):
Displays RSI for the given period (default is 14).
RSI is calculated using pre-market data when available.
QQQ:
Shows the percentage change of the QQQ ETF from the previous day’s close.
The QQQ percentage change is color-coded: green for positive, red for negative, and gray for no change.
Customizable Inputs:
Visibility Options: Toggle the visibility of each metric, such as volume, dollar volume, RVOL, ADR, ATR, RSI, and QQQ.
Pre-Market Data: Enable or disable the display of pre-market data for volume and dollar volume.
Table Positioning: Adjust the position of tables displaying the metrics either at the bottom-left or bottom-right of the chart.
Text Color and Table Background: Choose between white or black text for the tables and customize the background color.
Tables:
The script utilizes tables to display multiple metrics in an organized and easy-to-read format.
The values are updated dynamically, reflecting real-time data as the market moves.
Pre-Market Data:
The script calculates pre-market volume and dollar volume, along with other key metrics like RSI and RVOL, to help assess market sentiment before the market officially opens.
The pre-market data is accumulated from 4:00 AM to 9:30 AM ET, allowing for pre-market analysis and comparison to regular market hours.
User-Friendly and Flexible:
This script is designed to be highly customizable, giving you the ability to toggle which metrics to display and where they appear on the chart. You can easily focus on the data that matters most to your trading strategy.

ADR Table BY @ICT_YEROADR Table BY @ICT_YERO
Created by: @ICT_YERO
This custom indicator is designed to provide the Average Daily Range (ADR) for multiple timeframes, including Daily, 4-Hour, and 1-Hour. The indicator is tailored to assist traders in understanding price volatility and making informed trading decisions.
Key Features
Multi-Timeframe ADR Calculation:
Automatically calculates and displays the ADR for Daily, 4-Hour, and 1-Hour timeframes.
Helps traders identify potential price movement ranges for different trading sessions.
Dynamic Range Visualization:
Clear visual representation of the ADR on the chart, making it easy to spot price extremes.
Real-time updates to reflect changes in price movement.
Custom Alerts:
Option to set alerts when the price approaches the ADR high or low.
Useful for identifying potential reversal zones or breakout opportunities.
User-Friendly Interface:
Simple and intuitive settings to customize colors, levels, and display preferences.
Seamlessly integrates with your existing TradingView setup.
ICT-Inspired Methodology:
Designed for traders who follow ICT concepts, focusing on precision and high-probability setups.
Applications
Range Trading: Helps determine the high and low boundaries for scalping or intraday setups.
Volatility Analysis: Understand market behavior during different times of the day or week.
Reversal Zones: Identify areas where price is likely to reverse, based on ADR extremes.
Whether you're a scalper, day trader, or swing trader, this indicator provides a comprehensive overview of price volatility across multiple timeframes, making it an essential tool for your trading arsenal.

Swing Data - Optimized SK60
v. 1.83
indicator adjust to time frame.
This Pine Script code generates a trading indicator that calculates and displays various data points on a stock, including Average Daily Range (ADR%), Market Cap, Current Volume, Free Cash Flow (FCF) Yield %, Float %, whether moving averages (MA) are inline, and the moving averages of certain indexes like the Russell 2000, Nasdaq 100, and S&P 500. Here’s a breakdown of the script and how to use it.
Key Concepts and Functionality
Indicator Definition: The script begins by defining the indicator with a title (Swing Data - Optimized ADR%...) and short title (Optimized Swing Data), which will appear on the chart. The overlay=true command ensures that the indicator is drawn on the main price chart rather than in a separate pane.
Sector and Ticker:
s = syminfo.tickerid: This stores the ticker ID of the stock being analyzed.
sector = syminfo.sector: This retrieves the sector to which the stock belongs. If the sector information is unavailable, it assigns the value "N/A".
Dynamic Inputs: Several input parameters allow you to customize the indicator:
adrp_len: Defines the length for ADR% calculation.
len: Defines the moving average length for volume.
tbl_size, bg_col, and txt_col: Control the table's appearance, including the size of the text, background color, and text color.
posTable: Allows positioning of the table on the chart. Options include top-left, top-right, bottom-left, and bottom-right.
show_empty_row: Adds an empty row above the displayed values if set to true.
Volume Unit Handling (f_vol_unit): This function converts volume into appropriate units, like thousands (K), millions (M), or billions (B), to make volume easier to read. It’s applied to both the current volume and the average daily volume.
Moving Averages for Indexes (f_ma_indexes): This function calculates the 10-day, 20-day, 50-day, and 200-day simple moving averages (SMAs) for an index (such as Russell 2000 or Nasdaq 100). It also checks whether the MAs are inline, meaning if shorter MAs are above longer MAs, which is usually a bullish sign. It returns the result as "YES" or "NO" and assigns a color (green for yes, red for no).
Volume and Price Data: The script fetches several important data points:
vol_display: Current volume in human-readable units.
avgDaVol: Average daily volume.
adrp: Average Daily Range (ADR%) over a specified length.
fcf_yield_percent: Free Cash Flow Yield percentage.
ADR Calculation: The ADR% is calculated using the formula 100 * (ta.sma(high / low, adrp_len) - 1) and is fetched for the daily timeframe.
FCF Yield Color Logic: The Free Cash Flow yield is classified into three categories:
Green: Undervalued if FCF yield is over 5%.
Yellow: Neutral between 2-5%.
Red: Overvalued if below 2%.
MA's Inline Check for the Stock: The script checks if the stock's 10-day, 20-day, 50-day, and 200-day moving averages are inline (i.e., in a bullish alignment where shorter MAs are higher than longer MAs).
Float % Calculation: The float percentage is calculated as the ratio of float shares outstanding (FSO) to total shares outstanding (TSO). The color is set based on its breakout potential:
Red: Below 20% (manipulation risk).
Green: 20-50% (ideal breakout range).
Yellow: Above 50%.
Price Change %: The script calculates the percentage change in price between the current and previous close.
Volume Color Logic: The color of the "Current Volume" is based on whether it indicates buying or selling pressure:
Green: Volume is higher than average, and the price increased more than ADR%.
Red: Volume is higher than average, and the price decreased more than ADR%.
Yellow: Default color if neither condition is met.
Market Cap: The market cap is calculated by multiplying the total shares outstanding (TSO) by the current close price, and it’s displayed in a human-readable unit (K, M, or B).
Display Table:
A table is created to display all the calculated data in an organized manner. It includes fields for Market Cap, Avg Volume, ADR%, Current Volume, FCF Yield %, Float %, MA's Inline status, and Sector. Additionally, it shows the inline status for the Russell 2000, Nasdaq 100, and S&P 500.
How to Use:
Customization: Users can customize the inputs, including the length of ADR% and volume moving averages, and adjust the table size, text color, and position.
Visualization: The indicator provides a comprehensive table on the chart showing key data points for technical analysis, including whether moving averages are inline for both the stock and major indexes.
This indicator is particularly useful for swing traders or technical analysts who want a clear overview of a stock’s volume, volatility (via ADR%), and the alignment of moving averages, combined with fundamental metrics like market cap and free cash flow yield.

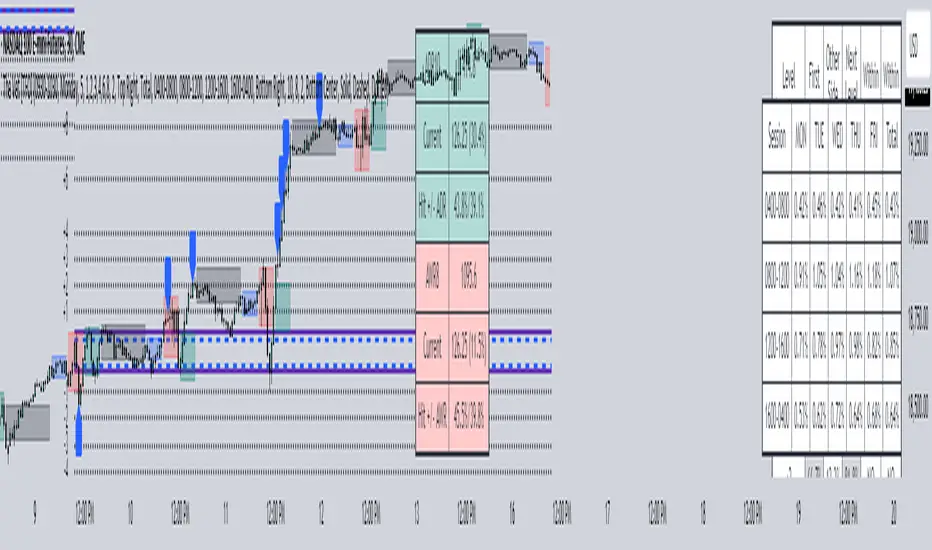
The Vet [TFO]In collaboration with @mickey1984 , "The Vet" was created to showcase various statistical measures of price.
The first core measurement utilizes the Defining Range (DR) concept on a weekly basis. For example, we might track the session from 09:30-10:30 on Mondays to get the DR high, DR low, IDR high, and IDR low. The DR high and low are the highest high and lowest low of the session, respectively, whereas the IDR high and low would be the highest candle body level (open or close) and lowest candle body level, respectively, during this window of time.
From this data, we use the IDR range (from IDR high to IDR low) to extrapolate several, custom projections of this range from its high and low so that we can collect data on how often these levels are hit, from the close of one DR session to the open of the next one.
This information is displayed in the Range Projection Table with a few main columns of information:
- The leftmost column indicates each level that is projected from the IDR range, where (+) indicates a projection above the range high, and (-) indicates a projection below the range low
- The "First Touch" column indicates how often price has reached these levels in the past at any point until the next weekly DR session
- The "Other Side Touch" column indicates how often price has reached a given level, then reversed to hit the opposing level of the same magnitude. For example, the above chart shows that if price hit the +1 projection, ~33% of instances also hit the -1 projection before the next weekly DR session. For this reason, the probabilities will be the same for projection levels of the same but opposite magnitude (+1 would be the same as -1, +3 would be the same as -3, etc.)
- The "Next Level Touch" column provides insight into how often price reaches the next greatest projection level. For example, in the above chart, the red box in the projection table is highlighting that once price hits the -2 projection, ~86% of instances reached the -3 projection before the next weekly DR session
- The last columns, "Within ADR" and "Within AWR" show if any of the projection levels are within the current Average Daily Range, or Average Weekly Range, respectively, which can both be enabled from the Average Range section
The next section, Distributions, primarily measures and displays the average price movements from specified intraday time windows. The option to Show Distribution Boxes will overlay a box showing each respective session's average range, while adjusting itself to encapsulate the price action of that session until the average range is met/exceeded. Users can choose to display the range average by Day of Week, or the Total average from all days. Values for average ranges can either be shown as point or percent values. We can also show a table to display this information about price's average ranges for each given session, and show labels displaying the current range vs its average.
The final section, Average Range, simply offers the ability to plot the Average Daily Range (ADR) and Average Weekly Range (AWR) of a specified length. An ADR of 10 for example would take the average of the last 10 days, from high to low, while an AWR of 10 would take the average of the last 10 weeks (if the current chart provides enough data to support this). Similarly, we can also show the Average Range Table to indicate what these ADR/AWR values are, what our current range is and how it compares to those values, as well as some simple statistics on how often these levels are hit. As an example, "Hit +/- ADR: 40%/35%" in this table would indicate that price has hit the upper ADR limit 40% of the time, and the lower limit 35% of the time, for the amount of data available on the current chart.
ADR (Log Scale) with MTF LabelsHere's a detailed presentation of the Average Daily Range (ADR) indicator, with a focus on its advantages compared to the classic ADR, its unique features, utility, and interpretation:
Advantages Compared to Classic ADR
1. Logarithmic Scale: Unlike the classic ADR, which uses a linear scale, this version uses a logarithmic scale for calculations. This approach provides a more accurate representation of relative price movements, especially for assets with large price ranges.
2. Multi-Timeframe Analysis: This enhanced ADR indicator allows traders to view daily, weekly, and monthly ADRs simultaneously. This multi-timeframe capability helps traders understand volatility trends over different periods, offering a more comprehensive market analysis.
3. Optional Smoothing: The inclusion of an optional smoothing feature (using Exponential Moving Average, EMA) helps reduce noise in the data. This makes the indicator more reliable by filtering out short-term fluctuations and highlighting the underlying volatility trend.
4. Information Display Labels: The indicator includes labels that display precise ADR values for each timeframe directly on the chart. This feature provides immediate, clear insights without requiring additional calculations or references.
Utility of the Indicator
1. Volatility Analysis: The ADR indicator is essential for assessing market volatility. By showing the average daily price range, it helps traders gauge how much an asset typically moves within a day, week, or month.
2. Risk Management: ADR levels can be used to set stop-loss points, improving risk management strategies. Knowing the average range helps traders avoid setting stops too close to the current price, which might otherwise be triggered by normal market fluctuations.
3. Setting Realistic Targets: By understanding the average daily range, traders can set more realistic profit targets. This helps in avoiding over-ambitious goals that are unlikely to be reached within the typical market movement.
4. Identifying Entry and Exit Points: The ADR can signal potential entry and exit points. For example, if the price approaches the upper or lower ADR boundary, it might indicate an overbought or oversold condition, respectively.
Interpretation and Examples
1. Increasing Volatility: If the ADR is increasing, it indicates rising market volatility. Traders might adjust their strategies accordingly, such as widening their stop-losses to accommodate larger price swings.
2. Range Breakout: If the price significantly exceeds the daily ADR, it may signal a strong trend or exceptional market movement. Traders can use this information to stay in the trade longer or to anticipate a potential reversal.
3. Mean Reversion: Prices often revert to the ADR mean. A trader might consider mean reversion trades when the price approaches the extremes of the ADR range, expecting it to move back towards the average.
4. Multi-Timeframe Comparison: If the daily ADR is higher than the weekly ADR, it may indicate unusually high short-term volatility. This can be a signal for traders to be cautious or to capitalize on the increased movement.
While the ADR indicator provides valuable insights into market volatility and can significantly enhance trading strategies, it is essential to remember that no indicator is foolproof. Market conditions can change rapidly, and past performance is not always indicative of future results. Traders should use the ADR indicator in conjunction with other tools and follow sound risk management practices to protect their capital.

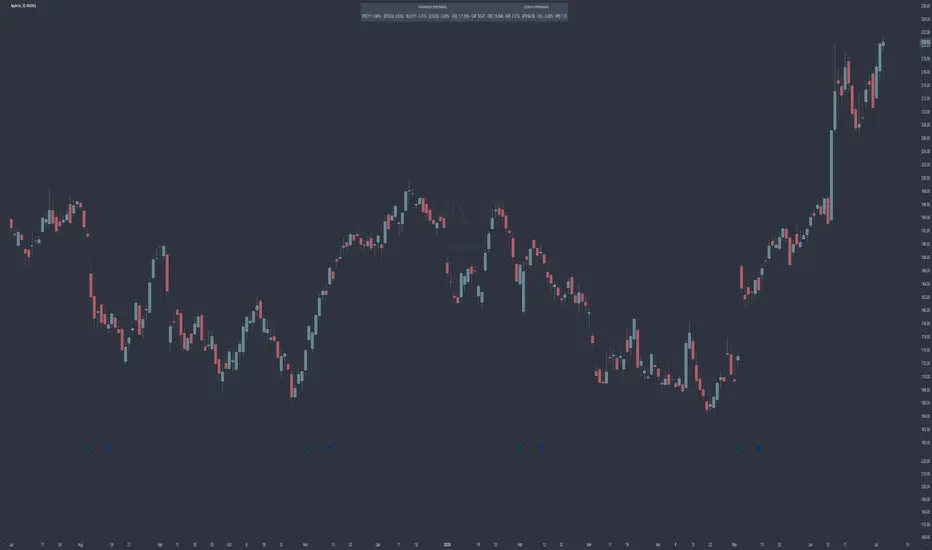
Performance IndicatorsDescription:
The Performance Indicators tool provides traders with a comprehensive overview of both fundamental and technical performance metrics of a security. This dual approach helps traders make informed decisions by evaluating the security's intrinsic value as well as its market behavior.
Fundamental Performance Indicators:
EPS Year Over Year % Growth : Measures the percentage growth in earnings per share (EPS) compared to the same quarter in the previous year. This helps in understanding the company's profitability trends.
EPS 3 Quarters Year Over Year % Growth : Analyzes the percentage growth in EPS over the last three quarters compared to the same quarters in the previous year, providing insight into the company's recent earnings performance.
Sales Year Over Year % Growth : Tracks the percentage growth in sales compared to the same quarter in the previous year, offering a view of the company's revenue trends.
Sales 3 Quarters Year Over Year % Growth : Evaluates the percentage growth in sales over the last three quarters compared to the same quarters in the previous year, helping to assess the company's recent revenue performance.
Return On Equity (ROE) : Measures the company's profitability by comparing net income to shareholder equity. This indicates how effectively the company is using its equity base to generate profits.
Market Capitalization : Represents the total market value of the company's outstanding shares, providing a sense of the company's size and market presence.
Float Shares Outstanding : Refers to the number of shares available for trading by the public, excluding restricted shares. This metric helps in understanding the liquidity and volatility of the stock.
Technical Performance Indicators:
Average Daily Range (ADR) %: Calculates the average range between the high and low prices over a specific period, expressed as a percentage. This helps in understanding the stock's daily volatility.
Average True Range (ATR) $ : Measures market volatility by calculating the average range between the high and low prices, taking into account any gaps in the price. It is expressed in dollar terms.
% Off 52-Week High : Indicates how far the current price is from the highest price achieved over the last 52 weeks, helping to assess the stock's current performance relative to its yearly peak.
Relative Price Strength (RPS) : Compares the stock's price performance to a benchmark index, helping to identify how the stock is performing relative to the broader market.
How it Works:
The fundamental performance indicators provide insights into the company's financial health and growth trends by analyzing key metrics such as EPS, sales growth, ROE, market capitalization, and float shares outstanding.
The technical performance indicators offer a view of the stock's market behavior and volatility through metrics like ADR, ATR, % off 52-week high, and RPS.
By combining these fundamental and technical metrics, traders can gain a well-rounded perspective on the security's overall performance.
How to Use:
Add the Performance Indicators tool to your chart.
Evaluate the fundamental indicators to assess the company's financial health and growth trends.
Analyze the technical indicators to understand the stock's market behavior and volatility.
Use the combined insights from both fundamental and technical indicators to make informed trading decisions.
This tool is particularly useful for traders who want to integrate both fundamental analysis and technical analysis into their trading strategy, providing a holistic view of a security's performance.
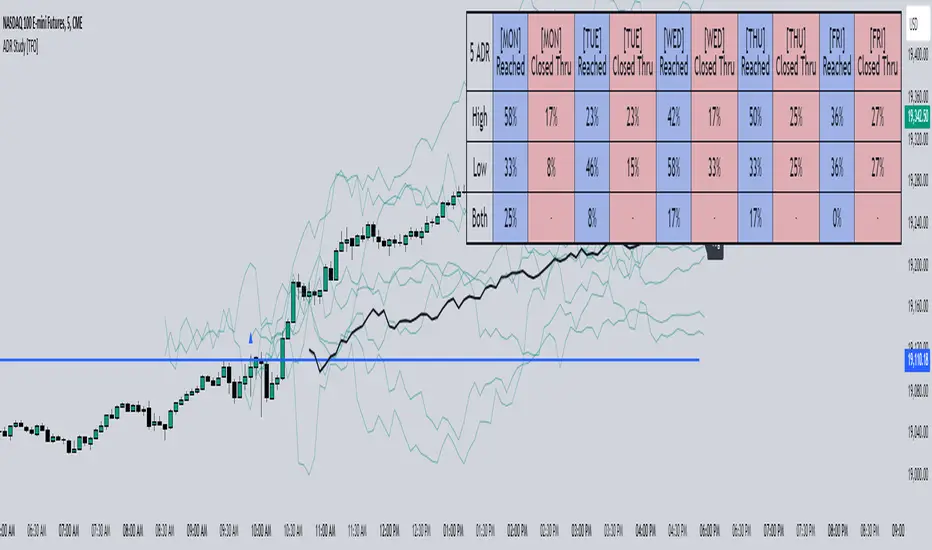
ADR Study [TFO]This indicator is focused on the Average Daily Range (ADR), with the goal of collecting data to show how often price reaches/closes through these levels, as well as a look at historical moves that reached ADR and at similar times of day to study how price moved for the remainder of the session.
The ADR here (blue line) is calculated using the difference between a day's highest and lowest points. If our ADR length is 5, then we are taking this difference from the last 5 days and averaging them together. At the following day's open, we take half of this average and plot it above and below the daily opening price to place theoretical limits on how far price may move according to the lookback period. The triangles indicate when price has reached ADR (either +ADR or -ADR), and alerts can be created for these events.
The Scale Factor is an optional parameter to scale the ADR by a certain amount. If set to 2 for example, then the ADR would be 2x the average daily range. This value will be reflected in the statistics options so that users can see how different values affect the outcomes.
Show Table will display data collected on how often price reaches these levels, and how often price closes through them, for each day of the week. By default, these are colored as blue and red, respectively. From the following chart of NQ1!, we can see for example that on Mondays, price reached +ADR 38% of the time and closed through it 23% of the time. Note that the statistics for closing through the ADR levels are derived from all instances, not just those that reached ADR.
Show Sample Sizes will display how many instances were collected for all given sets of data. Referring to the same example of NQ1!, we can see that this particular chart has collected data from 109 Mondays. From those Mondays, 41 reached +ADR (38%, verifying our initial claim) and 25 closed through it (23%). This is important to understand the scope of the data that we're working with, as percentages can be misleading for smaller sample sizes.
Show Histogram will plot the same exact data as the table, just in a histogram form to visually emphasize the differences on a day-by-day basis. On this chart of RTY1!, we can see for example from the top histogram that on Wednesdays, 40% reached +ADR and only 22% closed through it. Similarly if we look at the bottom histogram, we can see that Wednesdays reached -ADR 46% of the time and closed through it only 28% of the time.
We can also use Show Sample Sizes to display the same information that would be in the table, showing how many instances were collected for each event. In this case we can see that we observed 175 Fridays, where 76 reached +ADR (43%) and 44 closed above it (25%).
Show Historical Moves is an interesting feature of this script. When enabled, if price has reached +/- ADR in the current session, the indicator will plot the evolution of the close prices from all past sessions that reached +/- ADR to see how they traded for the remainder of the session. These calculations are made with respect to the ADR range at the time that price traded through these levels.
Historical Proximity (Bars) allows the user to observe historical moves where price reached ADR within this many bars of the current session (assuming price has reached an ADR level in the current session). In the above chart, this is set to 1000 so that we can observe each and every instance where price reached an ADR level. However, we can refine this a bit more.
By limiting the Historical Proximity to something like 20, we are only considering historical moves that reached ADR within 20 bars of todays +ADR reach (9:50 am EST, noted by the blue triangle up). We can enable Show Average Move to display the average move by the filtered dataset, and Match +/-ADR to only observe moves inline with the current day's price action (in this case, only moves that reached +ADR, since price has not reached -ADR).
We can add one more filter to this data with the setting Only Show Days That: closed through ADR; closed within ADR; or either. The option either is what you see above, as we are considering both days that closed through ADR and days that closed within it (note that in this case, closing within ADR simply means that price reached +ADR and closed the day below it, and vice versa for -ADR; this does not mean that price must have closed in between +ADR and -ADR). If we set this to only show instances that closed within ADR, we see the following data.
Alternatively, we can choose to Only Show Days That closed through ADR, where we would see the following data. In this case, the average move very much resembles the price action that occurred on this particular day. This is in no way guaranteed, but it makes an interesting case for how we could use this data in our analysis by observing similar, historical price action.
Please note that this data will change over time on a rolling basis due to TradingView's bar lookback, and that for this same reason, lower timeframes will yield less data than larger timeframes.
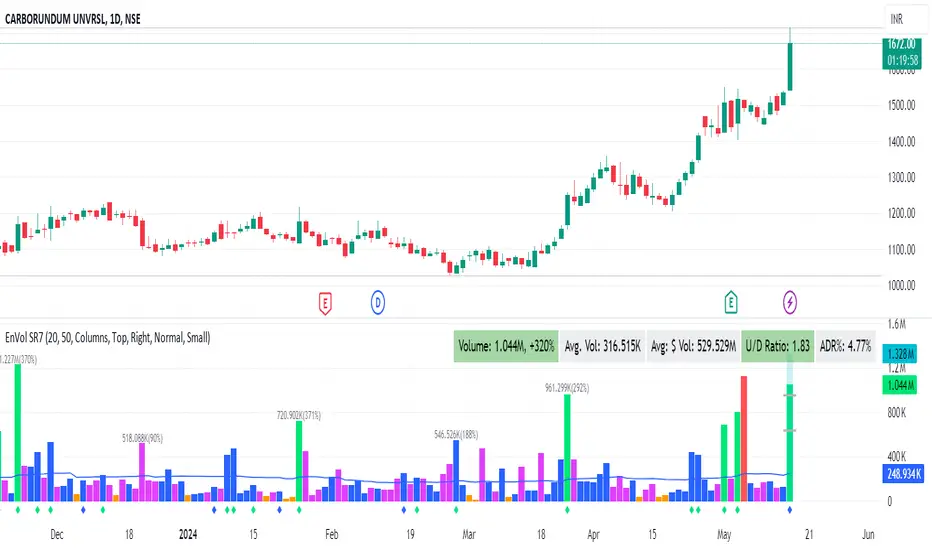
Enhanced Volume by SR7SiddharthaRay007's Enhanced Volume Indicator works on any Timeframe
⦿ Volume Labels:
1. Current Volume, Volume Change%, Average Volume, Average Doller Volume, Up/Down Ratio, ADR%.
=>Average value can be changed using 'Lookback Length' (Default: 20)
⦿ Simple Moving Average: MA (Default: 50). Color of MA changes based on the up down volume ratio.
1. Up/Down Ratio > 1: Blue
2. Up/Down Ratio < 1: Orange
⦿ Volume Bar Colors:
1. High Relative Volume Positive Candle: Lime Green .
2. High Relative Volume Negative Candle: Red .
3. Normal Volume Positive Candle: Blue .
4. Normal Volume Negative Candle: Fuchsia .
5. Low Relative Volume Positive/Negative Candle: Orange .
=>High Relative Volume > 300% of Average Volume; Low Relative Volume < 30% of Average Volume
⦿ Pocket Pivot (A pocket pivot is an up day with volume greater than any of the down days volume in the past 10 days)
1. 10 day Pocket Pivots: Lime Green Diamond below volume bar
2. 5 day Pocket Pivots: Blue Diamond below volume bar
⦿ 'Highest Volume (HV) ' on top of the Volume Bar:
1. Highest Volume Ever (HVE)
2. Highest Volume in Over a Year (HVY)
⦿ Projected Volume Bar: Aqua
⦿ Plot a line at 2x and 3x Average Volume and set Alerts
ADR % RangesThis indicator is designed to visually represent percentage lines from the open of the day. The % amount is determined by X amount of the last days to create an average...or Average Daily Range (ADR).
1. ADR Percentage Lines: The core function of the script is to apply lines to the chart that represent specific percentage changes from the daily open. It first calculates the average over X amount of days and then displays two lines that are 1/3rd of that average. One line goes above the other line goes below. The other two lines are the full "range" of the average. These lines can act as boundaries or targets to know how an asset has moved recently. *Past performance is not indicative of current or future results.
The calculation for ADR is:
Step 1. Calculate Today's Range = DailyHigh - DailyLow
Step 2. Store this average after the day has completed
Step 3. Sum all day's ranges
Step 4. Divide by total number of days
Step 5. Draw on chart
2. Customizable Inputs: Users have the flexibility to customize the script through various inputs. This includes the option to display lines only for the current trading day (`todayonly`), and to select which lines are displayed. The user can also opt to show a table the displays the total range of previous days and the average range of those previous days.
3. No Secondary Timeframe: The ADR is computed based on whatever timeframe the chart is and does not reference secondary periods. Therefore the script cannot be used on charts greater than daily.
This script is can be used by all traders for any market. The trader might have to adjust the "X" number of days back to compute a historical average. Maybe they only want to know the average over the past week (5 days) or maybe the past month (20 days).

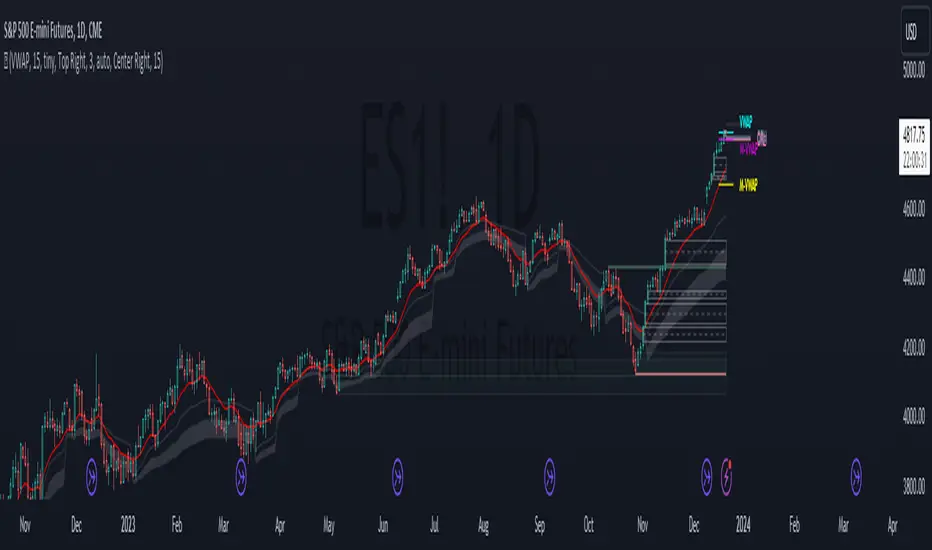
Average Range Levels [Pro+]Description:
The Average Range Levels builds on the concepts of ADR projections showcased in its lite version.
Average Daily Range (ADR) is a common metric used to measure volatility in an asset. It calculates the average difference between the highest and lowest price over a time interval – normally five days.
The Inner Circle Trader teaches the importance of this metric from an algorithmic point of view; in particular the 1/3ADR price level is deemed to be a threshold used to determine the area at which a Judas Swing – false move to trick market participants, protraction, manipulation – might exhaust.
Another key difference in the ICT-use of this metric compared to the classic approach is that the average range is calculated from New York midnight Time, rather than the daily candle's open.
This exact concept was upscaled to higher Timeframe fractals obtaining the Average Weekly Range (AWR) and the Average Monthly Range (AMR). The latter two metrics are anchored at the first Monday’s midnight (New York Time) of the respective interval – however they also have the option to be anchored at the True Week Open (Tuesday’s Daily Open) and True Month Open (Second Week Open).
It is crucial to remember that the elements of Time are key when it comes to interpreting how price action will, or won't, react to these levels: what Time of the day is it? what day of the week? what week of the month?
If one thinks about the Power of Three of a candle (Accumulation, Manipulation Distribution), it is highly unlikely that a Manipulation event will happen later in the candle’s development – seeing the 1/3ADR hold in London session or New York open, seeing the 1/3AWR hold on Tuesday or Wednesday, or seeing price race to the 1/3AMR early on in the month gives undeniable edge to an Analyst.
Apart from the 1/3 level seen from a Judas perspective, the opposing 1/3 level, and the full AR projections, are excellent algorithmic levels at which we will see orderflow or reactions worth studying. These can be take profit targets, reversal opportunities, pyramid entries, …
Last but not least, the tool is equipped with a Data Table. You have a clear narrative but you are unsure of when price will expand? Track the previous 5 ARs and the current Range for Daily, Weekly, and Monthly – the smaller the AR the higher the chance for an expansion, the larger the AR the higher the chance for a consolidation.
Tool Features:
Auto Color the drawings based on your chart’s background or choose your own
Decide whether to consider daily candles, or New York (00:00 to 00:00 NY Time) for the basis of the calculation
Show the last 10 Historical Levels
– See the AR Range, the AR price levels and 1/3AR price levels by hovering over the text labels
Plot the AR levels from their Time Anchor, or as offset markers on the side for a cleaner look
Show/Hide all elements individually
In the Idea below, you can see how INDEX:BTCUSD hit the 1/3AMR level at the end of the second week of the month. The subsequent rejection from this level suggests we might have witnessed a Judas Swing, hence we flip to bullish bias.
In the more recent AWR levels, we can see how price did not touch any level until friday – this is a consolidation week with low probability setups. This was expected, if one looks at the precious two week's ranges and respective average ranges in the Data Table: both breached the AR value, due to to the great expansion higher.
Lastly for the ADR levels we can see how the Judas higher got beautifully stopped at the 1/3 level, and the full ADR level on the opposite side catches price while it falls.
To Get Access, and Level Up see the Author's Instructions below!
This indicator is available only on the TradingView platform.
⚠️ Intellectual Property Rights ⚠️
While this tool's base concepts are public, its interpretation, code, and presentation are protected intellectual property. Unauthorized copying or distribution is prohibited.
⚠️ Terms and Conditions ⚠️
This financial tool is for educational purposes only and not financial advice. Users assume responsibility for decisions made based on the tool's information. Past performance doesn't guarantee future results. By using this tool, users agree to these terms.
Script de pago

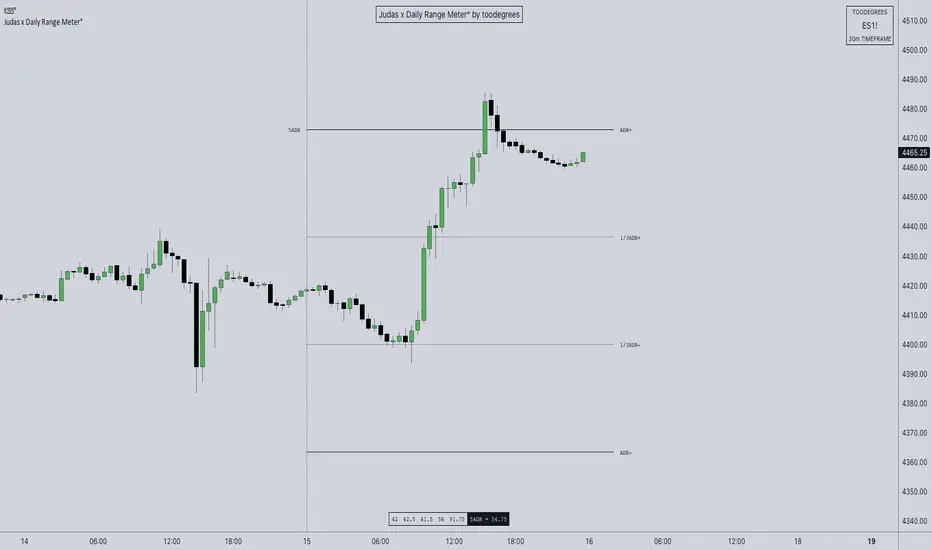
ICT ADR Levels - Judas x Daily Range Meter°The Average Daily Range (ADR) is a common metric used to measure volatility in an asset. It calculates the average difference between the highest and lowest price over a time interval – normally five days.
The Inner Circle Trader teaches the importance of this metric from an algorithmic point of view; in particular the 1/3ADR price level is deemed to be a threshold used to determine the area at which a Judas Swing – false move to trick market participants, protraction, manipulation – might exhaust. Another key difference in the ICT-use of this metric compared to the classic approach is that the average range is calculated from New York midnight Time, rather than the daily candle's open .
It is crucial to remember that the elements of Time are key when it comes to interpreting how price action will, or won't, react to this level: what Time of the day is it? what day of the week? what week of the month?
Let's consider the Time of the day. If one thinks about the Power of Three of the daily candle (Accumulation, Manipulation Distribution), it is highly unlikely that a Manipulation event will happen later in the day – whereas seeing the 1/3ADR hold in London session or New York open gives undeniable edge to an Analyst.
Apart from the 1/3ADR level seen from a Judas perspective, the opposing 1/3 level, and the full ADR projections, are excellent algorithmic levels at which we will see orderflow or reactions worth studying. These can be take profit targets, reversal opportunities, pyramid entries, ... Study them, and find what works for you!
Features:
Display a table with the previous N days' ranges and the current ADR value
Decide whether to consider daily candles, or New York (00:00 to 00:00 NY Time) for the basis of the calculation
See the ADR Range, the ADR price levels and 1/3ADR price levels by hovering over the text labels
Plot the ADR levels from the Midnight Anchor, or as offset markers on the side for a cleaner look
Show/Hide all elements individually
Examples:
– CBOT_MINI:YM1! at Equity Open
– INDEX:BTCUSD Perfect Buy Day Signature
– FX:EURUSD Clean Break = No Judas
– TSX:GC Repeated Attempts = Liquidity Engineering
Swing Data - ADR% / RVol / PVol / Float % / Avg $ VolThis table presents consolidated data that swing traders can refer to quickly for their benefit. I am of the firm belief that the information provided in this uncomplicated table is precisely what you require to optimize your trading efficiency, and ultimately, profitability.
The data includes;
1. Market Capitalization - a measure of the total value of a publicly traded company's outstanding shares.
2. Float % - the percentage of a company's outstanding shares that are available for trading on the open market. It is calculated by dividing the number of a company's outstanding shares that are available for trading on the open market by the total number of outstanding shares. A lower float percentage generally means that there are fewer shares available for trading, which can lead to increased volatility in the stock price. On the other hand, a higher float percentage generally means that there are more shares available for trading, which can lead to greater stability in the stock price.
3. ADR% - a technical analysis indicator that measures the average daily price movement as a percentage of its current price. It is calculated by taking the difference between the average high and low prices for a time period, and then dividing it by the current price. The resulting value is then multiplied by 100 to give the ADR% for that day. The ADR% can be useful for traders to assess the potential volatility of a stock. A higher ADR% indicates a greater potential for price movement.
4. ATR - measures the range of price movements of an asset over a specified period of time, taking into account any gaps in price. It is calculated by taking the highest value of the following three values:
The difference between the current high and the current low
The absolute value of the difference between the current high and the previous close
The absolute value of the difference between the current low and the previous close
The resulting value is then averaged over the specified period of time to create the ATR value. This indicator is reflects the average volatility of the asset over the specified period of time.
5. LoD dist. - also refer to Low Of Day distance, a range level gauge of current price based on historical volatility of the price movement, in this case I use ATR. for the historical volatility. Please find below as example for the calculation.
eg. LoD dist. = 104%
Current price (A) = $24.49
Low Price (B) = $22.16
Difference (A) - (B) = $2.33
ATR = $2.25
LoD dist = $2.33 / $2.25 = 103.55% (round up to nearest whole number = 104%)
6. Average Daily $ Volume - used to measure the average amount of money that is traded in a stock or a security over a particular period of time, typically a day. It is calculated by multiplying the average daily trading volume of a security by its average price.
7. Average Daily Volume - used to measure the average no. of share that is traded in a stock or a security over a particular period of time, typically a day.
8. Projected Volume - an estimate of the total volume of trading activity that is expected to occur for the day (from the specific time data), based on an average volume over a specific period of time. Projected volume can be used by traders and investors to help make informed decisions about buying or selling securities, and can also be used as an indicator of market sentiment and volatility. However, it's important to note that projected volume is an estimate and actual trading activity may vary.
9. Relative Volume - a measure of the volume of a stock that is trading at the specific time, relative to its average trading volume over a longer period. It is expressed as a percentage and is often used by traders and investors to identify stocks that are trading with higher or lower than usual volume.
ATR/ADR coveredThis indicator is used to gauge the current price movement of the instrument relative to its Daily ATR and Daily ADR%.
The indicator has 4 parameters on its panel.
ADR% - This shows the average daily price range for the past given period.
ATR - This shows the average true range of the past given period.
Atr covered - Expressed in %, this shows how much of the ATR, the price has covered today.
Adr covered - Expressed in %, this shows how much of the ADR%, the price has covered today.
This indicator can be used to gauge how far the intraday price has moved from its ADR% and ATR and hence decide whether the stock is extended or not.
Note: The Indicator only shows values based on Daily timeframe.
-ve value of Atr covered is relative to the price direction of the instrument in comparison to yesterday.

PATIThis indicator is part of our educational suite focused on teaching price structure, momentum, and mean reversion trading strategies for intraday trading. Our team has selected this set of tools and metrics, which define our trading style and serve as the foundation for our teaching, to be included in this indicator. We are displaying each component in a way we believe is helpful to their understanding which also provides a clean, comprehensive look.
This indicator is for Intraday Trading
Our Traders most commonly use this indicator on the 1,3 or 5 minute chart.
Components of this Indicator:
Multiple VWAP Levels: monthly, weekly, standard (anchored to the right of price)
Dynamically Anchored VWAP Cloud (trend tool)
13 EMA (trend tool)
Structural Orderblocks
Multi-Timeframe Fair Value Gap detection
Key Daily Price Levels (anchored to the right of price)
Customizable Opening Range (anchored to the right of price)
15 minute “Golden Zone” (shows the .5-.618 zone of the previous 15m candle)
ADR (Average Daily Range)
A4R (Average 4hr Range)
These tools are used in conjunction with the education we provide to help our users determine their optimal trade plan to utilize their edge.
Specific Functionalities and Uses:
Monthly-VWAP & Weekly-VWAP (M-VWAP/W-VWAP):
VWAP = “Volume Weighted Average Price”
These levels provide probable zones where price may mean revert and risk should be taken off/ put on. We have anchored these to the right-hand side of your chart by default to minimize the noise on your chart.
Average Daily Range (ADR): The Average Daily Range is a technical indicator used to measure the volatility of an asset. It displays how much an instrument can move on average during a given day. The significance is that each market has a unique range that is likely to be covered on any given day.
Average 4hr Range (A4R): The Average 4hr Range is a technical indicator used to measure the volatility of an asset twice in a single session. It displays how much an instrument can move on average during a session and is measured twice in a day. Calculating a smaller volatility range may seem strange at first but can be a huge advantage by analyzing the volatility of the intraday action, giving you average price targets based on more recent market data.
Tip: When used in conjunction with key support and resistance levels, ADR & A4R can be a huge edge to traders to determine where to push/pull risk.
Opening Range: The open often establishes the trend and sentiment for the day, but there is also statistical significance to the open that is overlooked. Statistically, on average, the open is near the high or low of the day and offers plenty of opportunities to build trading strategies. The chart below provides some potential trades that could be taken once the opening range has been established.
Dynamically Anchored VWAP Cloud: Our dynamically anchored VWAP cloud tracks the most recent impulsive move and re-anchors to show you potential bounce points in a trend. We re-anchor at each structural shift to give the most probable targets for buyers/sellers to defend their positions to continue the current trend push.
By utilizing the re-anchoring at each significant structural inflection point, we can establish a much less lagging trend following technique.
We have also included the feature to substitute this cloud for a 34/55 EMA cloud for the traders already familiar with that system.
The chart below provides potential trades that could be taken using the VWAP cloud system.
FVGS (Fair Value Gaps/ Imbalances): These areas represent potential buy/sell side liquidity imbalances where price is pushed aggressively, sweeping the orderbook and will likely return to “fix” the structure before continuing. Below is an example of 3 possible trade paths we look for inside these structural imbalances.
Structural Orderblocks:
These areas are based on structural pivots that have been pushed out of with aggression determined by subsequent structural breaks to confirm their validity. Because of this, when price returns to these areas we can anticipate this area to be defended.
The blue boxes track Orderblocks. These highlight instances of past participation which create areas likely to be defended again when retested.
Swing High/Low/Previous:
We use swing high and lows as points of short-term support and resistance, a break of these levels can signify a shift in market sentiment.
-The dashed green line shows the previous structural swing high or low pivot point.
-The solid green lines show the high and low in our current trading structure.
Note: Displaying the previous swing can provide us with context of the current market trend, and will assist us make better decisions.
15 Minute Golden Zone:
Displayed as a gray box, it tracks the .5-.618 of the previous 15m candle and gives us an area where we look for short-term resistance/support on smaller time frame price action. This area can be viewed as an equilibrium of the current range. If the price can hold this area, it can show a likely support area for continuation.
13 EMA:
This is the choice length ema of our traders, they use this ema to confirm (short-term) trend direction and reference it for a common bounce point for re-entries. Our traders consider this as a crucial point to speculate reversals and break of short-term trends.
Note: Typically in a trend we see the price hold to one side of this ema, by looking for this characteristic, it brings confidence to staying in trades.
Please check the Author Instructions Below for how to gain access to our indicators.
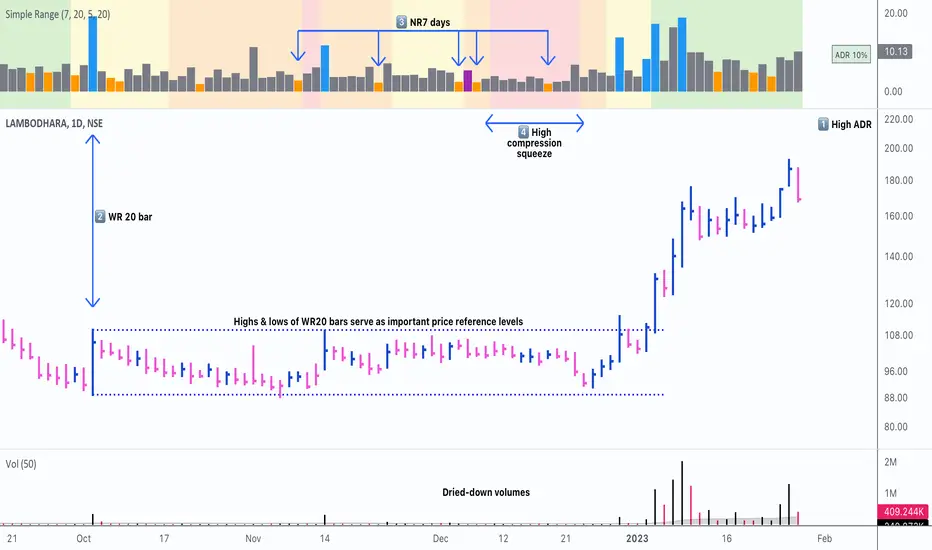
Simple RangeThe daily price range is a good proxy to judge an instrument’s volatility. I have combined multiple concepts in this indicator to display information regarding the daily price range & its volatility.
A trading period's range is simply the difference between its high and the low. This script shows the daily high-to-low range of the price as a column chart. It has 3 main components:
1. Narrow-range days (NR7) & Wide-range Days (WR20) - as plot columns
Original concept from Thomas Bulkowski
Modified from "NR4 & NR7 Indicator" script by theapextrader7
Modified from "WR - BC Identifier" script by wrpteam2020
Narrow range days mark price contractions that often precede price expansions. This script uses NR7 (narrow range 7) as a narrow-range day. This value can be changed by the user if, instead of an NR7, he or she wishes to use NR4 or NR21, or any other interval of his or her choice. NR7 is an indecisive trading day in which the range is narrower than any of the previous six days (a total of 7 days). This is a popular concept given by Thomas Bulkowski. A breakout is said to occur when price closes above the top or below the bottom of the NR7. Upside breakout of an NR 7 candle with high volumes indicates bullishness.
Similarly, highs & lows of wide-range bars (on big volumes) are also significant reference levels for price. Wide-range candle are identified by size of the body candle (open - close). The script compares the size of previous 20 candles to identify WR20 candles. This value can also be changed by the user.
The script shows NR7 & WR20 as orange & blue bars, respectively.
The user can also turn on the option to identify a big high-to-low range candle greater than a pre-defined threshold (default is 5%). These show up as green or red bars.
2. TTM Squeeze - as background
Original concept from John Carter's book "Mastering the Trade"
Based on "Squeeze Momentum Indicator" script by LazyBear
John Carter’s TTM Squeeze indicator looks at the relationship between Bollinger Bands and Keltner's Channels to help identify period of volatility contractions. Bollinger Bands being completely enclosed within the Keltner Channels is indicative of a very low volatility. This is a state of volatility contraction known as squeeze. Using different ATR lengths (1.0, 1.5 and 2.0) for Keltner Channels, we can differentiate between levels of squeeze (High, Mid & Low compression, respectively). Greater the compression, higher the potential for explosive moves.
In the script, the High, Mid & Low compression squeezes are depicted via the background color being red, orange, or yellow, respectively.
3. Average Daily Range - as table
Original idea by alpine_trader
Modified from "ADR% - Average Daily Range % by MikeC" script by TheScrutiniser
Average Day Range (ADR) tells how much the price moves between the high and low on a given day. This is the day Range, which is then averaged to create ADR. The script uses an average of the last 20 days to calculate the ADR. Unlike ATR (Average True Range), this excludes Gaps.
The script displays the ADR as a % value in a table.
If you want to find stocks that move a lot on an average on most days, then look for stocks that have ADR% of 5% or more.
If you prefer lower volatility stocks, focus on stocks with lower ADR% values, such as 2% or less.
How it comes together
For a bullish "momentum burst", or a velocity trade:
Select stocks with Average Day Range % (ADR) greater than 5
Identify significant reference price levels via highs & lows of WR20 bars (on big volumes)
Wait for a decent mid-to-high compression squeeze
Look for clusters of NR7 candles in the consolidation
Any breakout from this consolidation should be accompanied by more than average (preferably pocket pivot) volumes
ATR PivotsThe "ATR Pivots" script is a technical analysis tool designed to help traders identify key levels of support and resistance on a chart. The indicator uses various metrics such as the Average True Range (ATR), Daily True Range ( DTR ), Daily True Range Percentage (DTR%), Average Daily Range (ADR), Previous Day High ( PDH ), and Previous Day Low ( PDL ) to provide a comprehensive picture of the volatility and movement of a security. The script also includes an EMA cloud and 200 EMA for trend identification and a 1-minute ATR scalping strategy for traders to make informed trading decisions.
ATR Detail:-
The ATR is a measure of the volatility of a security over a given period of time. It is calculated by taking the average of the true range (the difference between the high and low of a security) over a set number of periods. The user can input the number of periods (ATR length) to be used for the ATR calculation. The script also allows the user to choose whether to use the current close or not for the calculation. The script calculates various levels of support and resistance based on the relationship between the security's range ( high-low ) and the ATR. The levels are calculated by multiplying the ATR by different Fibonacci ratios (0.236, 0.382, 0.5, 0.618, 0.786, 1.000) and then adding or subtracting the result from the previous close. The script plots these levels on the chart, with the -100 level being the most significant level. The user also has an option to choose whether to plot all Fibonacci levels or not.
DTR and DTR% Detail:-
The Daily True Range Percentage (DTR%) is a metric that measures the daily volatility of a security as a percentage of its previous close. It is calculated by dividing the Daily True Range ( DTR ) by the previous close. DTR is the range between the current period's high and low and gives a measure of the volatility of the security on a daily basis. DTR% can be used as an indicator of the percentage of movement of the security on a daily basis. In this script, DTR% is used in combination with other metrics such as the Average True Range (ATR) and Fibonacci ratios to calculate key levels of support and resistance for the security. The idea behind using DTR% is that it can help traders to better understand the daily volatility of the security and make more informed trading decisions.
For example, if a security has a DTR% of 2%, it suggests that the security has a relatively low level of volatility and is less likely to experience significant price movements on a daily basis. On the other hand, if a security has a DTR% of 10%, it suggests that the security has a relatively high level of volatility and is more likely to experience significant price movements on a daily basis.
ADR:-
The script then calculates the ADR (Average Daily Range) which is the average of the daily range of the security, using the formula (Period High - Period Low) / ATR Length. This gives a measure of the average volatility of the security on a daily basis, which can be useful for determining potential levels of support and resistance .
PDH /PDL:-
The script also calculates PDH (Previous Day High) and PDL (Previous Day Low) which are the High and low of the previous day of the security. This gives a measure of the previous day's volatility and movement, which can be useful for determining potential levels of support and resistance .
EMA Cloud and 200 EMA Detail:-
The EMA cloud is a technical analysis tool that helps traders identify the trend of the market by comparing two different exponential moving averages (EMAs) of different lengths. The cloud is created by plotting the fast EMA and the slow EMA on the chart and filling the space between them. The user can input the length of the fast and slow EMA , and the script will calculate and plot these EMAs on the chart. The space between the two EMAs is then filled with a color that represents the trend, with green indicating a bullish trend and red indicating a bearish trend . Additionally, the script also plots a 200 EMA , which is a commonly used long-term trend indicator. When the fast EMA is above the slow EMA and the 200 EMA , it is considered a bullish signal, indicating an uptrend. When the fast EMA is below the slow EMA and the 200 EMA , it is considered a bearish signal, indicating a downtrend. The EMA cloud and 200 EMA can be used together to help traders identify the overall trend of the market and make more informed trading decisions.
1 Minute ATR Scalping Strategy:-
The script also includes a 1-minute ATR scalping strategy that can be used by traders looking for quick profits in the market. The strategy involves using the ATR levels calculated by the script as well as the EMA cloud and 200 EMA to identify potential buy and sell opportunities. For example, if the 1-minute ATR is above 11 in NIFTY and the EMA cloud is bullish , the strategy suggests buying the security. Similarly, if the 1-minute ATR is above 30 in BANKNIFTY and the EMA cloud is bullish , the strategy suggests buying the security.
Inside Candle:-
The Inside Candle is a price action pattern that occurs when the current candle's high and low are entirely within the range of the previous candle's high and low. This pattern indicates indecision or consolidation in the market and can be a potential sign of a trend reversal. When used in the 15-minute chart, traders can look for Inside Candle patterns that occur at key levels of support or resistance. If the Inside Candle pattern occurs at a key level and the price subsequently breaks out of the range of the Inside Candle, it can be a signal to enter a trade in the direction of the breakout. Traders can also use the Inside Candle pattern to trade in a tight range, or to reduce their exposure to a current trend.
Risk Management:-
As with any trading strategy, it is important to practice proper risk management when using the ATR Pivots script and the 1-minute ATR scalping strategy. This may include setting stop-loss orders, using appropriate position sizing, and diversifying your portfolio. It is also important to note that past performance is not indicative of future results and that the script and strategy provided are for educational purposes only.
In conclusion, the "ATR Pivots" script is a powerful tool that can help traders identify key levels of support and resistance , as well as trend direction. The additional metrics such as DTR , DTR%, ADR, PDH , and PDL provide a more comprehensive picture of the volatility and movement of the security, making it easier for traders to make better trading decisions. The inclusion of the EMA cloud and 200 EMA for trend identification, and the 1-minute ATR scalping strategy for quick profits can further enhance a trader's decision-making process. However, it is important to practice proper risk management and understand that past performance is not indicative of future results.
Special thanks to satymahajan for the idea of clubbing Average True Range with Fibonacci levels.

Average Range @coldbrewroshTaking the average daily range from low to high or high to low isn't the "best" way to get an idea of how much to set targets. So, I made this indicator to make the system better.
This indicator calculates the daily range from Open to High on Bullish Days & Open to Low on Bearish Days .
Nobody can catch the absolute low of the day on bullish days and get out at the high but one can enter at a reasonable price around the open ( 17:00 EST ) .
To complement the Average Range, another table shows the movement in the opposite direction.
For Instance: On Bullish Days how much it moved from Open to Low so that we have an idea of where to put the stop loss and vice versa. The time ranges calculated are the last 5 days, last 1 month, last 3 months & last 1 year.
Note #1: Even though the date range is predefined, it has a different meaning. For Instance: date range of last 5 days means "calculation of the range of last 5 bullish daily candles & not last 5 days" .
Note #2: Exclusive to Forex at the time of posting this.

Sw1tchFX - Average Daily RangeDESCRIPTION AND OVERVIEW
The Average Daily Range is a measure of volatility (typically across 5 days for the FX markets). I originally saw this being used in a trading system called ANTSSYS by Daryll Guppy and some other developers. I couldn't find it anywhere so I decided to build it from scratch.
What this does is allow you to measure volatility across various FX assets (I will apply other asset classes in the future that this is applicable to i.e. Crypto, Commodities, Blue Chip Stocks), and set realistic targets based off that volatility. Overall, this makes much more sense to me in the FX markets rather than support and resistance lines because it's based off the actual movement of the asset class. Market research shows that an asset class has a 80-85% chance to reach 75% of it's Average Daily Range (ADR).
Let's take a look at the daily ADR on the GBPNZD 15m chart. Notice how the values of the ADR act as real support and resistance based off the volatility of the asset. In this case, price did not quite reach the 75% ADR target.
Let's take a look at another example on EURNZD 15m chart. In this case, price hit the 75% target.
It's important to note that these levels do not bound the price. The probability that price exceeds it's 75% ADR is fairly low, but not impossible. Especially during important news events. Let's look at the recent USDCHF 15m chart for example.
Additionally, you can use these values to measure longer term movements (Weekly, and Monthly)
Here is a weekly view:
And a monthly view:
HOW I USE THIS
I use this in conjunction with some other indicators I've developed. Typically, I use range bars since I only care about price, not time. Additionally, averages are smoother when time is not taken into account and only price.
HOW THE CANDLE OPEN AND CLOSE IS CALCULATED
This is done based off of your own specific time zone and from the daily candle. So for me on PST, the daily candle will close at 1400. Once closed, a new ADR value is automatically calculated and added to the chart. There is an option to show past ADR values if you would like to see them or conduct additional research.

[co.n.g.] ADR 5/10/14/20Average Daily Range (ADR) over 5/10/14/20 Days
What it is
One of the oldest measurements of price volatility that is being used in technical and statistical trading is the range of a specific period of past days to estimate probability of chances, risk and price movements, as seen f.e. in
Molodovsky, N. (1967). Building a Stock Market Measure—A Case Study. Financial Analysts Journal, 23:3, 43-46 , DOI: 10.2469/faj.v23.n3.43.
Problem
After having tried all available community scripts I've encountered various indifferences, especially since Pine v5.
First, the anchor period changed, when I've switched between regular and extended trading hours.
- This meant, that the anchor switched between the official open of the day and the first bar of a new day beginnig at 00:00 UTC (or the corresponding timezone).
Second, thus in some scripts also changed the calculated average range, including or excluding pre market and after hours.
And therefor third, in many cases the distance between open and ADR high/low was indiffferent, putting one closer and the other further away.
Why is that?
After having tried seven different modes of calulation - from ta. to array, it appeared that especially since Pine v5 the calulation is lagging when calling
the request.security function and is thus rendering the calculations indifferent.
Especially the open is lagging and plotting delayed, about 15 minutes on a M1-chart or about 45 minutes on a M15 chart, which made id difficult to spot open (test) drives
- as f.e. described in Dalton, J. F., Jones, E. T., & Dalton, R. B. (1990). Mind over markets: power trading with market generated information. 1st edition . Probus. -
and estimating extremely strong or weak open moves.
While switching between regular and extended intraday charts, the open was either calculated on the open as request of "D" (open of the regular session)
and "1440" (which means full intraday since 00:00 UTC or the corresponding timezone), leading to undesired anchoring.
After having tried about five different anchoring periods and comparing the adr to @TradingView 's stock screener, there was no proper calulation or plotting possible,
if not partially hardcoded (being the least desired, elegant or flexible method).
Visualizing the problem
As described in the picture:
@sherwind 's ADR is plotting entirely wrong! I couldn't even figure out (even the source is available) whre the problem is rooted.
@treypeng 's ADR is anchored properly, but unfortunately the calculation is wrong.
Originality
As evident in the attached picture - and you are able to compare this to @TradingView 's stock screener - in this script as well the ADR is calculated PROPERLY
as well as the anchoring is set PROPERLY within the first tick of the session.
As matter of fact, you don't have to examine different timeframes, charts or sessions simoultaneously to see the correct levels and
you're able to ease observations and focus on your trading.
Innovation
There is no innovative approach, as described above, simply because this statistical approach is around since the 1960's.
Considering coding, neither is, but it is properly calculated and anchored.
What this script does
Anchoring at the first tick of the new New York session
Plotting the actual - not the past nor future - average day range (gray lines in picture)
Plotting the actual - not the past nor future - 75% average day range ( silver lines in picture)
Vizualising ADR breakouts by colouring the backround green (long breakout) or read (short breakout)
Selection methods
Keeping it simple stupid, as of now:
Abiliy to chose between 5/10/14/20 days
Additional
Theory says, that we are staying within the ADR of 75% every day.
_
Alas, there are some exceptions.
If price is breaking out of the ADR, we are likely to move in this direction for the rest of the day.
If price has broken out of the ADR on the previous day, ist highly unlikely to expect another ADR breakout day,
which doesn't mean that there might not appear a strong or weak second day.
Notes
Designed for intraday stock trading of the U.S. market.
Best (and easiest) chances are to be spotted in special conditions.
//Cheers,
//Constantine

Average Daily Range Lines + VWAP by TenozenOANDA:EURUSD
Hello! I created an indicator called ADRL (Average Daily Range Lines). This is my first original work, and I hope it's helpful to you guys.
1. Let me explain a bit of how it works...
So first of I need the ADR value, as by default length I use 19 for it. I want this indicator to calculate every start of the new day and break if another new day starts, so if the target level isn't reached, then the value would start to go back to 0 and get the new target level of the day. The target level is based on the first ADR multiplied by how much "percent" we want for the target level to hit, based on the first ADR value of the day. When the new day starts, the algo would start to add up the ADR value. If the added ADR hits the target level, it starts to plot a line by the candlestick by its high, low, and mid-level; it would create a new line if there is a new target being hit. So that's it.
About the VWAP, I took Tradingview's VWAP. I added the anchored part so I can plot a line if there is a new target level being hit. I hope that's okay.
2. How to use it...
- Using this indicator is pretty easy. When a new box is being plotted, that means that's the time when you should trade, as the box is still fresh. The VWAP helps if the market is trending or not.
- You can treat this indicator just like an S&R, as the price tends to respect the box. So best to use it as a pullback trade.
- We can assume if the price above the box, is a buy; vice versa.
3. Best Market to use...
- I suggest a trade in a nonvolatile market. The more volatile the market is, the harder the box is to be respected by the price. But if you really want to trade in that market, I suggest adjusting the inputs by how the box is being respected.
4. Suggestions...
- Use this indicator in 5 minutes chart if you day trade.
- Try using 30 minutes and setting the percent input from 100 to 80 and changing the ADR length from 19 to 14, this is much more suitable if you tend to hold trades.

Three Legged Goose FuturesThree-Legged Goose is an all-in-one intraday trading system.
Three-Legged Goose Futures is the same system as our "Three-Legged Goose" indicator, simply optimized for futures trading by working across all futures market sessions.
Three-Legged Goose Futures ONLY works on futures charts, please use our original Three-Legged Goose for equities.
It features a sleek and customizable Opening range overlay with infinitely generating price targets, Average Daily Range Zones, Curated Anchored VWAPs, Total Volume and ATR analysis, as well as our state of the art Market Momentum Trend detection.
Three-Legged Goose also has important Daily levels, including the Previous Day's High and Low and the Current Days Open, three fully customizable Exponential Moving Averages, a customizable ema cloud, and a toggleable standard vwap .
Three-Legged Goose Futures also includes overnight highs and lows as well as previous New York Session highs and lows.
Using this indicator allows you to get rid of any unnecessary indicators that are taking up those valuable slots in TradingView.
AVWAP + ORBS:
The Opening Range Breakout system builds off of our recommended 15min opening range and does all of your price target calculations based on the width of the opening range. These targets are fully customizable within the settings,
to allow fine-tuning from ticker to ticker. We have programmed three Anchored vwaps at different time intervals to act as a dynamic trend-finding instrument. These, along with the opening range breakout system, can help you quickly spot the day's trend and dynamic support and resistance long before your standard moving averages have caught up with price intraday.
Average Daily Range Zones:
We believe these zones to be essential to trading, especially with our system. These zones tend to act as areas of major support and resistance as well as give an idea of the projected volatility of the underlying.
Market Momentum Trend Detection:
We paint our momentum analysis directly on your candles. By taking the overall Market Internals + the underlying's Price movement, we can determine areas where we feel comfortable adding risk on or taking risk off.
This will help those that struggle at identifying trends and valid reversals.
All of the default settings are our recommended settings.
Please check the Author Instructions Below for how to gain access to our indicators.
