ABCD Harmonic Pattern Strategy (Bull + Bear) This script is a strategy implementation of the classic ABCD Harmonic Pattern, designed for market structure analysis, backtesting, and educational research.
The ABCD pattern is one of the foundational harmonic price patterns in technical analysis. Its Fibonacci ratio relationships were formalized and standardized within harmonic trading theory by Scott M. Carney, whose work helped define modern harmonic pattern rules.
This strategy is conceptually inspired by educational ABCD pattern logic shared by the TradingView author theEccentricTrader.
The code, structure, execution logic, filters, and risk management have been independently developed, reconstructed, and extended into a complete TradingView strategy.
What this strategy does
Detects bullish and bearish ABCD harmonic patterns based on price structure and Fibonacci ratios.
Reconstructs ABCD market structure logic for both directions instead of using a simple visual inversion.
Draws the ABCD legs, structure labels (A, B, C, D), and projection levels directly on the chart.
Generates long and short trade entries using confirmed ABCD structures.
Includes optional confluence filters, such as:
Higher-timeframe EMA trend filter
RSI strength filter
ATR volatility filter
Volume confirmation
Candle body confirmation
Minimum bounce distance from point D
Provides built-in risk management, including:
Configurable Stop Loss
Configurable Take Profit
Optional trailing stop
Designed for backtesting, parameter optimization, and analytical research.
Why this strategy is different
This script is not a simple indicator conversion nor a basic bullish/bearish mirror.
The ABCD pattern logic has been recreated at the structural level to better reflect how bullish and bearish market formations behave in real price action.
Key differences
Reconstructed bullish and bearish structures
Bullish and bearish ABCD patterns are independently defined using market structure logic, not just inverted visually.
Each direction has its own pivot relationships and validation rules to produce a more faithful representation of the ABCD pattern.
Structure-aware pattern validation
Pattern confirmation is based on price swings, structure continuity, and Fibonacci alignment, helping reduce distorted or forced patterns.
Strategy-based execution
Unlike indicator-only ABCD tools that only visualize patterns, this script uses strategy.entry and strategy.exit, enabling full backtesting and performance analysis.
Confluence-driven entries
Trade entries can require multiple confirmation layers beyond the pattern itself, helping reduce low-quality signals and overtrading.
Integrated risk management
Stop Loss, Take Profit, and optional trailing logic are applied consistently for both long and short positions.
Non-repainting design
Pattern detection and entries rely on confirmed bars (barstate.isconfirmed) and higher-timeframe data with lookahead_off, ensuring signals do not repaint historically.
Improved and controlled visualization
Pattern drawings, projections, and entry markers are managed with strict object limits to comply with TradingView performance and publishing requirements.
How to use
Add the strategy to a chart and select a symbol and timeframe.
Enable or disable filters under “Entry Filters (Confluence)”.
Configure Stop Loss, Take Profit, and trailing behavior under “TP/SL”.
Use pattern drawings and entry markers as visual and analytical confirmation, not as standalone trade signals.
Important notes
This script is provided for educational and research purposes only.
It does not provide financial or investment advice.
No profitability or performance is implied or guaranteed.
Past performance does not indicate future results.
Always test across multiple markets and timeframes and apply proper risk management.
Credits
ABCD Harmonic Pattern: Harmonic trading principles as formalized by Scott M. Carney.
Conceptual inspiration: Educational ABCD pattern logic shared by @theEccentricTrader on TradingView.
Pattern reconstruction, strategy logic, and risk management: Independent development.
ABC

ABC on Recursive Zigzag [Trendoscope]There are several implementations of ABC pattern in tradingview and pine script. However, we have made this indicator to provide users additional quantifiable information along with flexibility to experiment and develop their own strategy based on the patterns.
🎲 Highlights of this indicator over other ABC implementations are:
Implementation is based on recursive multi level zigzag allows bigger as well as smaller patterns to be identified
Allows users to set their trading rules with respect to entry, target and stop ratios, experiment and build their own strategy based on the ABC pattern.
Back test summary including win ratio and risk reward will help users understand the profitability based on different settings being used.
🎲 Concept of ABC Pattern
The ABC pattern, also known as the "Corrective Wave" or "Zigzag Pattern," is a fundamental concept in Elliott Wave Theory, which is widely used in technical analysis to identify and predict price movements in financial markets.
The ABC pattern is a three-wave corrective pattern that typically occurs within the context of a larger impulse or trending wave. It consists of two smaller waves in the opposite direction (A and C) separated by a corrective wave (B). These waves are labeled alphabetically and represent price movements.
Wave A (Impulse Wave): Wave A is the first leg of the ABC pattern and is characterized by a strong price move in the opposite direction of the prevailing trend. It is often driven by a fundamental or sentiment-driven event that temporarily disrupts the trend.
Wave B (Corrective Wave): Wave B is the corrective wave that follows Wave A. It represents a partial retracement of Wave A's price movement. Wave B can take various forms, such as a simple correction or a complex correction (e.g., a triangle or a flat correction). It typically doesn't retrace the entire length of Wave A.
Wave C (Impulse Wave): Wave C is the final leg of the ABC pattern and is characterized by a strong price move in the same direction as the prevailing trend. It often surpasses the starting point of Wave A and confirms the resumption of the larger trend.
🎲 Indicator Components
Upon loading the indicator on the chart, we can observe the following components on the chart.
Pattern Drawings is the graphical representation of present patterns. Please note that it is not necessary for patterns to be there on the chart all the time. Patterns will appear on the chart when price makes the patterns.
Trade Box is the box representing trade signals of the pattern. These trade levels are generated based on the user settings.
Summary Table is the back test summary containing details of historical pattern performance including Win Ratio and Risk Reward.
🎲 Indicator Settings
Details of each user settings are provided in the tooltips. Below is the snapshot of it.
🎲 Alerts
Basic level of alerts are built in the script using alert function to highlight the following conditions:
New ABC Pattern
Updates to existing Pattern
Both conditions will alert simple text messages. There is not much customization provided as part of this indicator. We will consider providing more options in future versions based on the interest and demand shown by users.

ABC finderI made this script a long time again and never released it. It is a ABC Pattern finding tool. You can adjust the "Bars Back" setting to include more or less bars in the pattern. I usually have it set to 10 or 15 these settings seem to work well on most assets. The scripts allows you to set up a trade box automatically and has a call out table to make prices levels more clear and easy to read. The trade box levels can be set by fixed percentage or by pattern based fib.
Hope it helps!

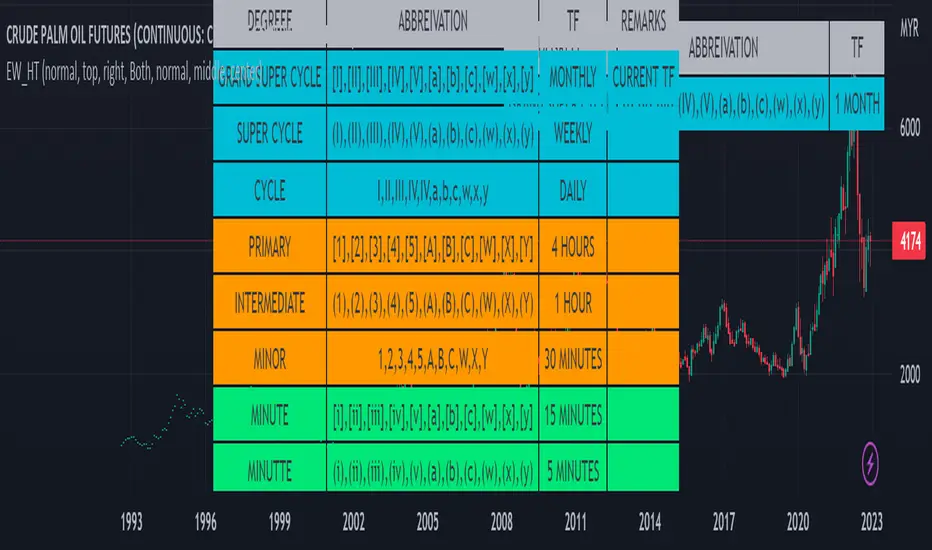
Elliot Wave Helper Table█ OVERVIEW
This indicator is intend to be helper to help Elliot Wave user to properly Elliot Wave tools according to correct degree such as 12345 or ABCWXY. The abbreviation changes according to timeframe.
█ FEATURES
1. Abbreviation degree adaptive to timeframe. Eg : Subminutte for 1 minute chart, etc.
2. Works for custom timeframe. Eg : Subminutte for 1 to 4 minute chart, etc.
3. Show reference table if necessary.
█ REFERENCE
Adaptive Elliot Wave Degree Chart
█ EXAMPLES / USAGES
Trading ABCHello Traders,
For a few months I have been getting requests from my followers about ABC pattern and finally I decided to make this indicator.
How it works?
- It creates Trend Cloud using Simple and Exponential moving averages with the lenghts 50, 100, 150, 200, 20, 40 by default and checks the trend. you can change the lengths as you wish
- It also creates ZigZag using the ZigZag Period in the options.
- Using last 2 zigzag waves it checks if there is suitable ABC pattern according the Trend, the Min/Max Fibonacci levels and Error Rate
- Then it check if the price bounces after this ABC pattern
- And if all these conditions met then it plot triangle
- If there are multiple bouncing then you can see multiple triangles
You can change/set;
- Zigzag Period
- Fibonacci Max level
- Fibonacci Min Level
- Error Rate
- The Lengths that are used for Moving Averages
- Keeping old ABC lines/labels
- Show Zigzag and min/max Fibonacci levels
- Show Trend Cloud
- and colors
if you don't want to see old ABC lines/labels you can disable it:
if you don't want to see Trend Cloud you can disable it:
Zigzag and Fibonacci levels:
P.S. if you have new ideas to improve this indicator then let me know please. We together can do this life easier!
Enjoy!
