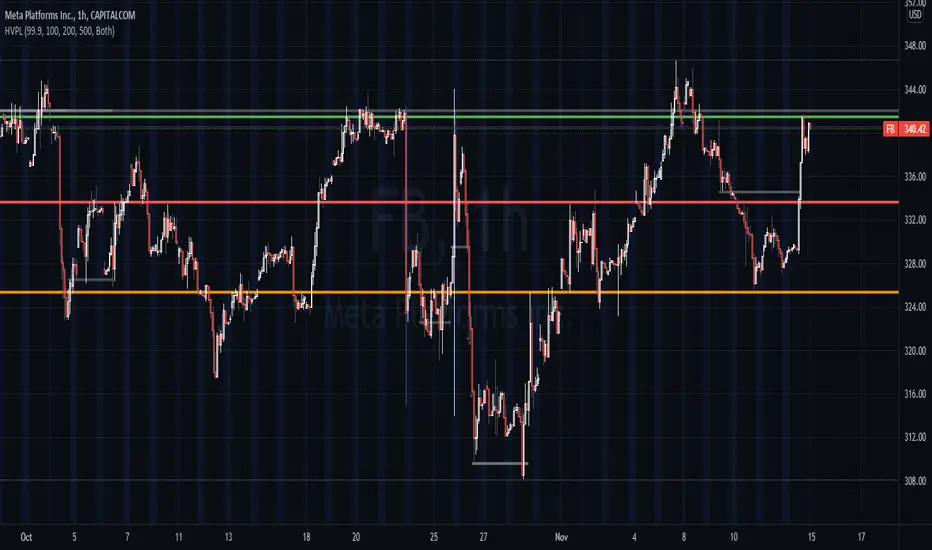
High Volume Price Levels x3This script detects recent huge volume areas to help you finding out good support and resistance levels.
For each of the 3 periods (defaults : 100, 200, 500) a new line will be drawn from the last time the volume amount exceeded n% (default 99%) of the highest volume on the same period, to the next occurence.
Most of time, these lines represent strong support and resistance levels which can be helpful in your technical analysis.
Options:
Volume trigger level: represents the minimum % of the highest volume within the given period on which you want to draw a new price level. (But higher this % is, stronger the levels will be)
Periods: The reference periods for high volume detection.
Show period: Enable/Disable the use of any period.
Period Color: Select a color correspondig to each period.
Show current levels only: Disable drawing of previous levels, to display current levels only.
Extend last level: Extend current lines to right/left/both or none sides of your chart.
Notes:
Sometimes, the last detected level from every periods can be the same at the same moment. In this situation, you'll only see one or two of the lines instead of three.
I'd like to figure out how to continuously draw every interesting levels without making the chart unreadable. Of course this script will be updated if I find a good way to do it.
Feel free to suggest any improvements/modifications.
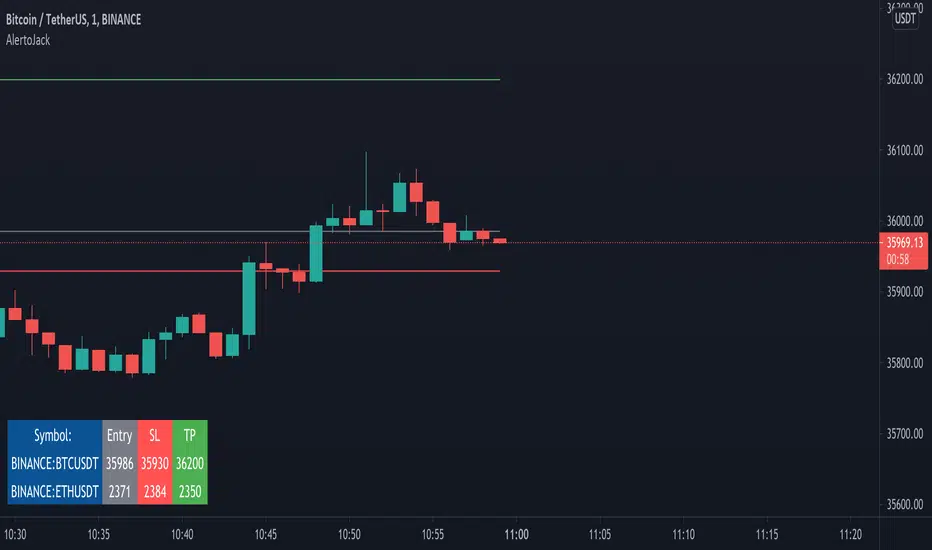
Example:
Indicador Pine Script®