OPEN-SOURCE SCRIPT
Actualizado MC vs Total MC

MC vs Total MC
this is an edit of StableCoin MC vs Total MC by Crypto5Max supporting muti timeframes and addition dominances
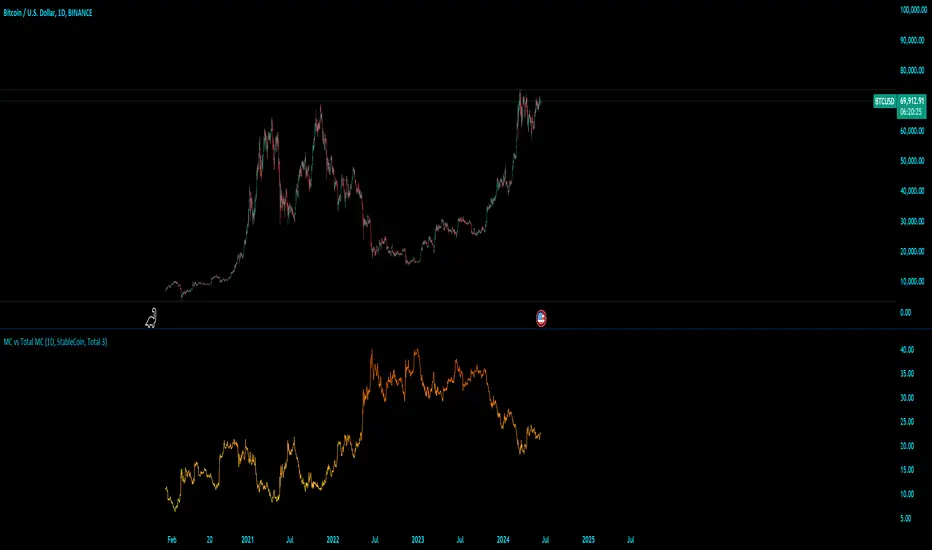
is a powerful and versatile TradingView indicator designed to help traders and analysts visualize the dominance of different types of cryptocurrencies (StableCoin, AltCoin, BTC, ETH) relative to the total market capitalization. This indicator provides a clear and concise way to monitor market trends and make informed decisions based on the dominance of specific cryptocurrency segments.
Key Features:
How It Works:
Use Cases:
Example:
If you select "AltCoin" as the dominance type and "Total 3" as the total market capitalization, the indicator will plot the dominance of AltCoins (excluding BTC and ETH) as a percentage of the total crypto market capitalization (excluding BTC and ETH) on the selected time frame. The dynamic label will display this percentage, updating as the market evolves.
Elevate your market analysis with the MC vs Total MC indicator and gain a comprehensive view of cryptocurrency dominance trends.
this is an edit of StableCoin MC vs Total MC by Crypto5Max supporting muti timeframes and addition dominances
is a powerful and versatile TradingView indicator designed to help traders and analysts visualize the dominance of different types of cryptocurrencies (StableCoin, AltCoin, BTC, ETH) relative to the total market capitalization. This indicator provides a clear and concise way to monitor market trends and make informed decisions based on the dominance of specific cryptocurrency segments.
Key Features:
- Customizable Time Frames: Select from a variety of time frames including 5 Min, 15 Min, 30 Min, 1HR, 2HR, 4HR, 8HR, and Daily to tailor the analysis to your needs.
- Dominance Type Selection: Choose the type of market capitalization dominance you want to track - StableCoins, AltCoins, Bitcoin, or Ethereum.
- Total Market Capitalization Options: Analyze the market with different total market capitalization metrics - total crypto market cap, total market cap excluding BTC, or total market cap excluding BTC and ETH.
- Dynamic Label Display: A label that follows the plotted dominance line and dynamically displays the dominance percentage, providing a clear visual representation.
- Invisible Background Option: Choose to have an invisible background for a cleaner chart presentation.
How It Works:
- Time Frame Selection: Use the time_frame input to choose the desired time frame for your analysis.
- Dominance Type Selection: Select the type of dominance to display using the mcap_type input.
- Total Market Capitalization Selection: Choose the total market capitalization metric with the total_sym input.
- Dominance Calculation: The indicator calculates the dominance of the selected cryptocurrency type as a percentage of the total market capitalization.
- Visual Display: The chosen dominance is plotted on the chart, and a label displaying the dominance percentage is dynamically updated to follow the plotted line.
Use Cases:
- Market Trend Analysis: Identify trends in the dominance of StableCoins, AltCoins, BTC, or ETH to gauge market sentiment.
- Portfolio Allocation: Make informed decisions about portfolio allocation by understanding the market share of different cryptocurrency types.
- Technical Analysis: Combine with other technical indicators to enhance your trading strategy and gain deeper market insights.
- This indicator is essential for traders, analysts, and investors who want to stay ahead of market movements and make data-driven decisions based on the dominance of various cryptocurrency segments.
Example:
If you select "AltCoin" as the dominance type and "Total 3" as the total market capitalization, the indicator will plot the dominance of AltCoins (excluding BTC and ETH) as a percentage of the total crypto market capitalization (excluding BTC and ETH) on the selected time frame. The dynamic label will display this percentage, updating as the market evolves.
Elevate your market analysis with the MC vs Total MC indicator and gain a comprehensive view of cryptocurrency dominance trends.
Notas de prensa
time frame options updatedNotas de prensa
- dominance side bar now shows % number
- added gradient
Notas de prensa
- option to use solid color or gradient
Notas de prensa
- pre calculated to help confusion or incorrect combos
- option to view mcap or dom
TODO:
- fix gradient maybe apply atr for gradient
- optimize code further
Notas de prensa
- optimizations
- code rewrite
- setting fixes
- dom/mcap fix
Notas de prensa
- added total total 2 and total 3 mcap viewable
TODO:
- gradient for MCAP
Script de código abierto
Fiel al espíritu de TradingView, el creador de este script lo ha convertido en código abierto, para que los traders puedan revisar y verificar su funcionalidad. ¡Enhorabuena al autor! Aunque puede utilizarlo de forma gratuita, recuerde que la republicación del código está sujeta a nuestras Normas internas.
Exención de responsabilidad
La información y las publicaciones no constituyen, ni deben considerarse como asesoramiento o recomendaciones financieras, de inversión, de trading o de otro tipo proporcionadas o respaldadas por TradingView. Más información en Condiciones de uso.