OPEN-SOURCE SCRIPT
FED Rate Decisions (Cuts & Hikes)
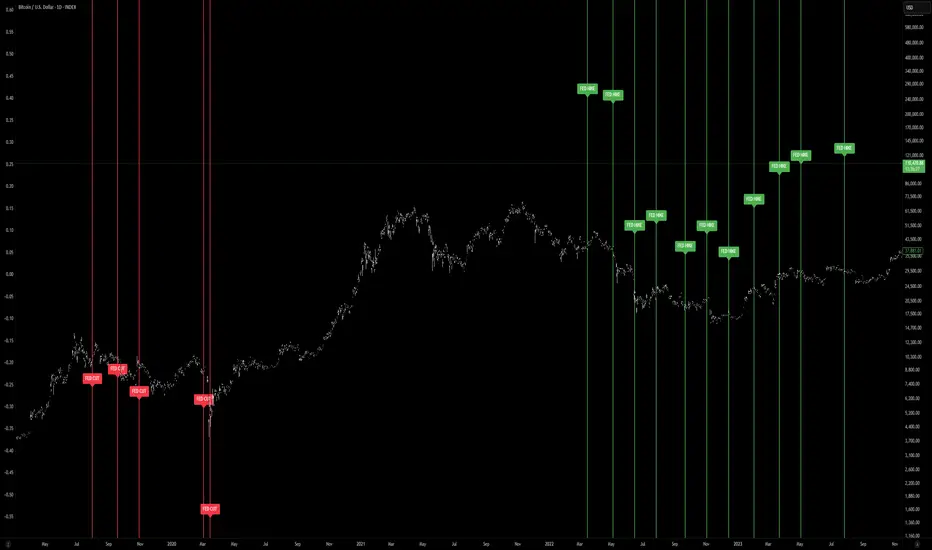
This indicator highlights key moments in U.S. monetary policy by plotting vertical lines on the chart for Federal Reserve interest rate decisions.
Features:
Rate Cuts (red): Marks dates when the Fed reduced interest rates.
Rate Hikes (green): Marks dates when the Fed increased interest rates.
Configurable view: Choose between showing all historical decisions or only those from 2019 onwards.
Labels: Each event is tagged with “FED CUT” or “FED HIKE” above or below the bar (adjustable).
Alerts: You can set TradingView alerts to be notified when the chart reaches a Fed decision day.
🔧 Inputs:
Show decisions: Switch between All or 2019+ events.
Show rate cuts / hikes: Toggle visibility separately.
Colors: Customize line and label colors.
Label position: Place labels above or below the bar.
📈 Usage:
This tool helps traders and investors visualize how Fed policy shifts align with market movements. Rate cuts often signal economic easing, while hikes suggest tightening monetary policy. By overlaying these events on price charts, you can analyze historical reactions and prepare for similar scenarios.
Script de código abierto
Fiel al espíritu de TradingView, el creador de este script lo ha convertido en código abierto, para que los traders puedan revisar y verificar su funcionalidad. ¡Enhorabuena al autor! Aunque puede utilizarlo de forma gratuita, recuerde que la republicación del código está sujeta a nuestras Normas internas.
Exención de responsabilidad
La información y las publicaciones no constituyen, ni deben considerarse como asesoramiento o recomendaciones financieras, de inversión, de trading o de otro tipo proporcionadas o respaldadas por TradingView. Más información en Condiciones de uso.