PROTECTED SOURCE SCRIPT
Actualizado Pullback Indicator
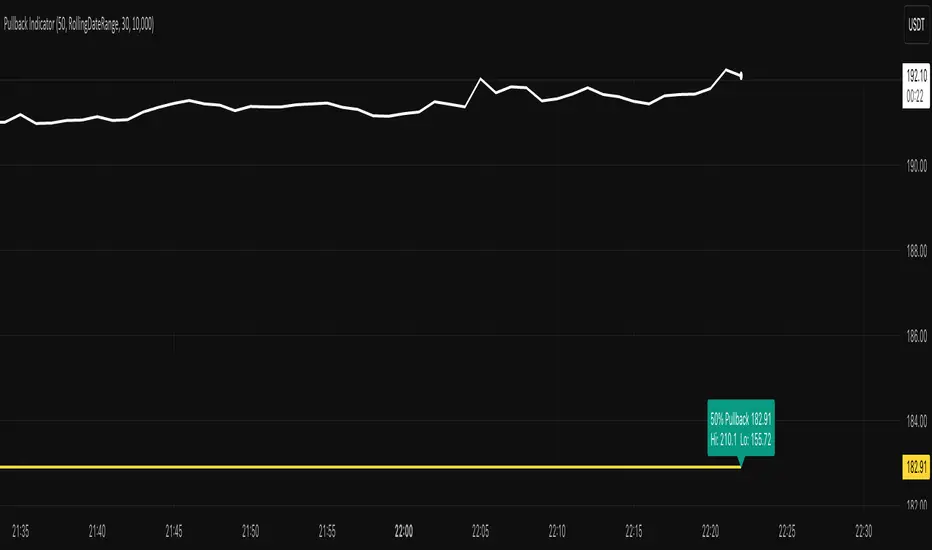
Pullback Indicator
Plots a retracement level between a detected swing High and Low at a user-defined % (e.g., 38.2, 50, 61.8).
Formula: Level = Low + (High − Low) × (Pullback % / 100).
Merging Y-Axis into one
Once you add this indicator to the chart, you will see two Y-axes (or two price scales). Right-click on the price scales on the right, select “Merge all scales into one,” and choose “On the right.”
Modes
• Rolling → High/Low from last N bars on the chart’s timeframe. Recomputed every bar. Good for intraday, fast-adapting ranges.
• RollingDateRange → High/Low from a calendar window (Daily context). Options:
• RollDays = last N calendar days
• or Use Fixed Start Date (window expands day by day)
• Exclude Forming Day = ignore today’s incomplete daily candle for stable intraday levels.
Levels update once per daily bar unless today is included.
Inputs
• Pullback %
• Range Mode (Rolling | RollingDateRange)
• Lookback (bars)
• RollDays / Fixed Start Date
• Exclude Forming Day
• Show Pullback Label
Why range choice matters
Peak & trough are subjective—different windows give different High/Low. Select your window based on trading horizon:
• Intraday → Rolling (bars)
• Swing/position → RollingDateRange (days/fixed date)
How often are High/Low recomputed?
• Rolling (bars):
Recomputed on every bar of the chart’s timeframe using the most recent lookbackBars window. Levels can change frequently.
• RollingDateRange (Daily context):
Computed once per daily bar for the configured calendar window.
• With Exclude Forming Day = ON, the High/Low only update after the prior daily bar closes.
• With it OFF, the current (forming) daily bar can update the High/Low intraday if it sets a new extreme.
⸻
Notas de prensa
Pullback IndicatorPlots a retracement level between a detected swing High and Low at a user-defined % (e.g., 38.2, 50, 61.8).
Formula: Level = Low + (High − Low) × (Pullback % / 100).
Merging Y-Axis into one
Once you add this indicator to the chart, you will see two Y-axes (or two price scales). Right-click on the price scales on the right, select “Merge all scales into one,” and choose “On the right.”
Modes
• Rolling → High/Low from last N bars on the chart’s timeframe. Recomputed every bar. Good for intraday, fast-adapting ranges.
• RollingDateRange → High/Low from a calendar window (Daily context). Options:
• RollDays = last N calendar days
• or Use Fixed Start Date (window expands day by day)
• Exclude Forming Day = ignore today’s incomplete daily candle for stable intraday levels.
Levels update once per daily bar unless today is included.
Inputs
• Pullback %
• Range Mode (Rolling | RollingDateRange)
• Lookback (bars)
• RollDays / Fixed Start Date
• Exclude Forming Day
• Show Pullback Label
Why range choice matters
Peak & trough are subjective—different windows give different High/Low. Select your window based on trading horizon:
• Intraday → Rolling (bars)
• Swing/position → RollingDateRange (days/fixed date)
How often are High/Low recomputed?
• Rolling (bars):
Recomputed on every bar of the chart’s timeframe using the most recent lookbackBars window. Levels can change frequently.
• RollingDateRange (Daily context):
Computed once per daily bar for the configured calendar window.
• With Exclude Forming Day = ON, the High/Low only update after the prior daily bar closes.
• With it OFF, the current (forming) daily bar can update the High/Low intraday if it sets a new extreme.
Notas de prensa
Pullback IndicatorPlots a retracement level between a detected swing High and Low at a user-defined % (e.g., 38.2, 50, 61.8).
Formula: Level = Low + (High − Low) × (Pullback % / 100).
Merging Y-Axis into one
Once you add this indicator to the chart, you will see two Y-axes (or two price scales). Right-click on the price scales on the right, select “Merge all scales into one,” and choose “On the right.” Also, please right-click again, select Labels -> make sure "Indicators and financials value label" is checked
Modes
• Rolling → High/Low from last N bars on the chart’s timeframe. Recomputed every bar. Good for intraday, fast-adapting ranges.
• RollingDateRange → High/Low from a calendar window (Daily context). Options:
• RollDays = last N calendar days
• or Use Fixed Start Date (window expands day by day)
• Exclude Forming Day = ignore today’s incomplete daily candle for stable intraday levels.
Levels update once per daily bar unless today is included.
Inputs
• Pullback %
• Range Mode (Rolling | RollingDateRange)
• Lookback (bars)
• RollDays / Fixed Start Date
• Exclude Forming Day
• Show Pullback Label
Why range choice matters
Peak & trough are subjective—different windows give different High/Low. Select your window based on trading horizon:
• Intraday → Rolling (bars)
• Swing/position → RollingDateRange (days/fixed date)
How often are High/Low recomputed?
• Rolling (bars):
Recomputed on every bar of the chart’s timeframe using the most recent lookbackBars window. Levels can change frequently.
• RollingDateRange (Daily context):
Computed once per daily bar for the configured calendar window.
• With Exclude Forming Day = ON, the High/Low only update after the prior daily bar closes.
• With it OFF, the current (forming) daily bar can update the High/Low intraday if it sets a new extreme.
Script protegido
Este script se publica como código cerrado. No obstante, puede utilizarlo libremente y sin ninguna limitación. Obtenga más información aquí.
Exención de responsabilidad
La información y las publicaciones no constituyen, ni deben considerarse como asesoramiento o recomendaciones financieras, de inversión, de trading o de otro tipo proporcionadas o respaldadas por TradingView. Más información en Condiciones de uso.