OPEN-SOURCE SCRIPT
MACD with Candle Display
MACD Calculation:
Uses user-defined Fast Length, Slow Length, and Signal Smoothing parameters to compute MACD.
Supports SMA (Simple Moving Average) or EMA (Exponential Moving Average) for the MACD line and signal line
Histogram-Based Candle Coloring:
The script categorizes histogram bars into four states:
0 (Very Bullish) → Green
1 (Likely Bearish) → Blue
2 (Likely Bullish) → Orange
3 (Very Bearish) → Red
Histogram Plot:
Displays histogram bars with distinct colors based on price momentum changes.
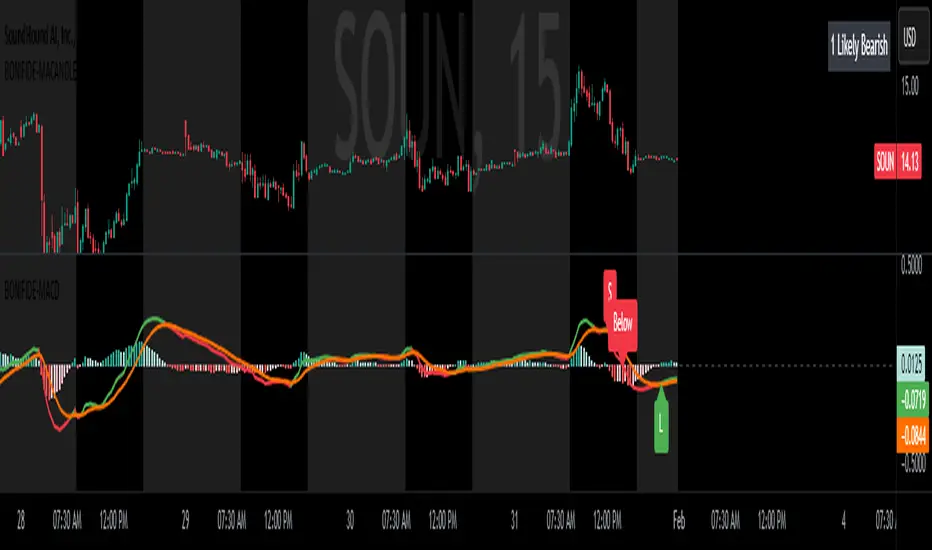
Market Sentiment Display in Status Line & Price Scale:
Instead of adding a label on the chart (which could obstruct candles), a text display is shown in the price scale and status line:
"0 Very Bullish"
"1 Likely Bearish"
"2 Likely Bullish"
"3 Very Bearish"
The text appears in the top-right corner with white font on a black background.
Purpose:
This indicator enhances the standard MACD by incorporating candle coloring and a cleaner sentiment display in the price scale, helping traders quickly interpret market momentum without cluttering the chart.
Uses user-defined Fast Length, Slow Length, and Signal Smoothing parameters to compute MACD.
Supports SMA (Simple Moving Average) or EMA (Exponential Moving Average) for the MACD line and signal line
Histogram-Based Candle Coloring:
The script categorizes histogram bars into four states:
0 (Very Bullish) → Green
1 (Likely Bearish) → Blue
2 (Likely Bullish) → Orange
3 (Very Bearish) → Red
Histogram Plot:
Displays histogram bars with distinct colors based on price momentum changes.
Market Sentiment Display in Status Line & Price Scale:
Instead of adding a label on the chart (which could obstruct candles), a text display is shown in the price scale and status line:
"0 Very Bullish"
"1 Likely Bearish"
"2 Likely Bullish"
"3 Very Bearish"
The text appears in the top-right corner with white font on a black background.
Purpose:
This indicator enhances the standard MACD by incorporating candle coloring and a cleaner sentiment display in the price scale, helping traders quickly interpret market momentum without cluttering the chart.
Script de código abierto
Fiel al espíritu de TradingView, el creador de este script lo ha convertido en código abierto, para que los traders puedan revisar y verificar su funcionalidad. ¡Enhorabuena al autor! Aunque puede utilizarlo de forma gratuita, recuerde que la republicación del código está sujeta a nuestras Normas internas.
Exención de responsabilidad
La información y las publicaciones no constituyen, ni deben considerarse como asesoramiento o recomendaciones financieras, de inversión, de trading o de otro tipo proporcionadas o respaldadas por TradingView. Más información en Condiciones de uso.