OPEN-SOURCE SCRIPT
Robot eVe Colorbox
A script to test the Colorbox strategy of the trading robot eVe.
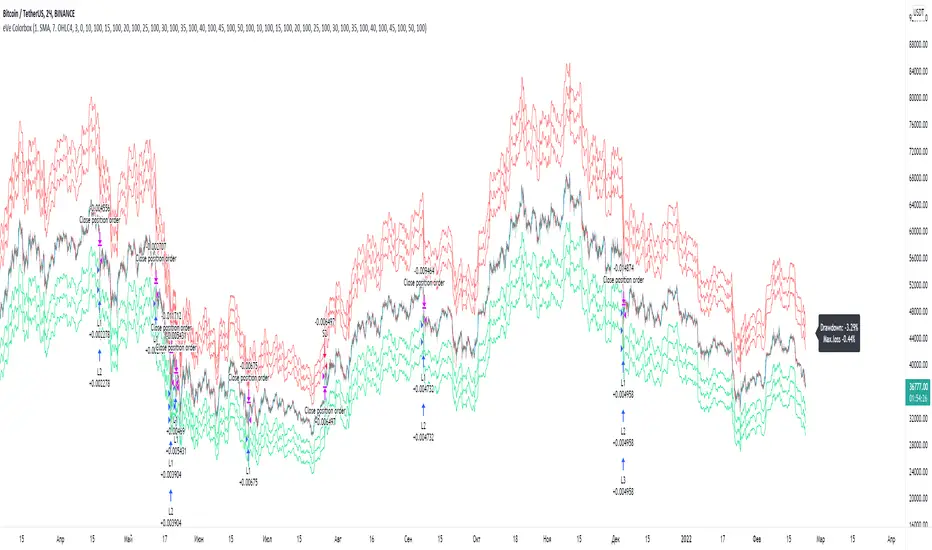
Lines
The blue line is the moving average and the reference point for the other lines.
Lime lines - a shifted moving average for opening a long position using a limit order.
Red lines - a shifted moving average for opening a short position using a limit order.
Strategy
Long positions are opened by a limit order at the price of the lime line.
Short positions shall be opened by a limit order at the price of the red line.
Any positions shall be closed by a market order.
If a long position is open, the position shall be exited upon the occurrence of any rising bar (green bar).
If a position is short, the position is exited on any falling bar (red bar).
This is a counter-trend strategy.
Exchange fees
A maker is used to enter.
A taker is used to exit.
The amounts for a maker and a taker are always equal.
For the backtest, the average commission = (maker_fee + taker_fee) / 2
Symbols
This is a very versatile strategy. It can be profitable on any trading pairs, on any asset class, and on any timeframe. But it requires the right parameters to perform well (see recommendations below).
Recommendations
The more volatile the asset, the better the strategy will work.
The more volatility , the more you need to set a slider for your orders.
The larger the time frame, the greater the number of slots required for orders.
Short positions are less profitable and more risky.
Short positions can be disabled altogether, it can be useful.
The strategy works very well for Crypto/Crypto trading pairs (e.g. ETH/BTC , DOGE/ETH, etc)
Script de código abierto
Fiel al espíritu de TradingView, el creador de este script lo ha convertido en código abierto, para que los traders puedan revisar y verificar su funcionalidad. ¡Enhorabuena al autor! Aunque puede utilizarlo de forma gratuita, recuerde que la republicación del código está sujeta a nuestras Normas internas.
Exención de responsabilidad
La información y las publicaciones no constituyen, ni deben considerarse como asesoramiento o recomendaciones financieras, de inversión, de trading o de otro tipo proporcionadas o respaldadas por TradingView. Más información en Condiciones de uso.