OPEN-SOURCE SCRIPT
Double RSI
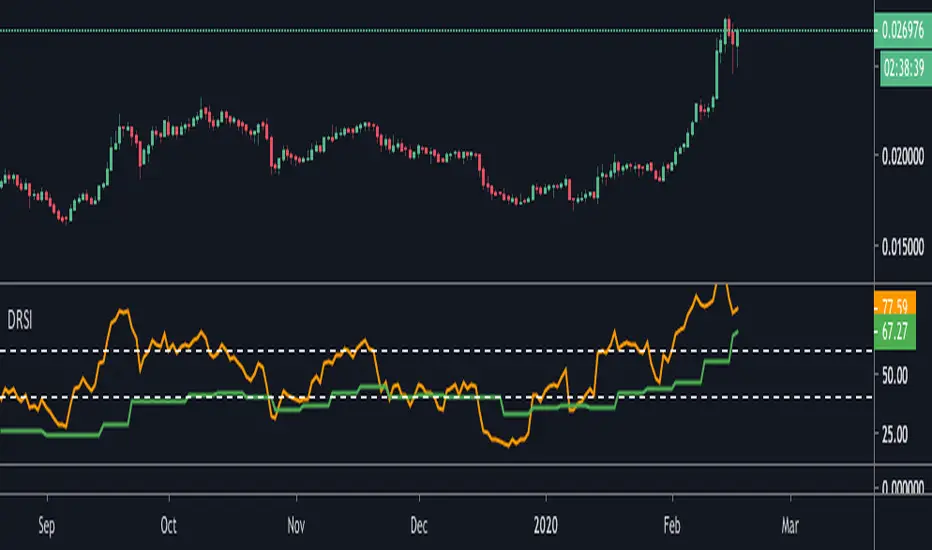
This is double RSI script which plots one time frame higher RSI along with the current time frame i.e
For Weekly chart it display Weekly and Monthly RSI
For Daily chart it display Daily and Weekly RSI
For Intraday chart it display Intraday and Daily RSI.
Usage:
If Daily RSI is above 60 and weekly above 40 and moving up then stock is in a good uptrend look for buying when Daily takes support at 60. Usually First test of Daily produces a good entry for subsequent entries probability decreases.
For Downtrend look for Daily RSI below 40 and weekly below 60.
Script de código abierto
Fiel al espíritu de TradingView, el creador de este script lo ha convertido en código abierto, para que los traders puedan revisar y verificar su funcionalidad. ¡Enhorabuena al autor! Aunque puede utilizarlo de forma gratuita, recuerde que la republicación del código está sujeta a nuestras Normas internas.
Exención de responsabilidad
La información y las publicaciones no constituyen, ni deben considerarse como asesoramiento o recomendaciones financieras, de inversión, de trading o de otro tipo proporcionadas o respaldadas por TradingView. Más información en Condiciones de uso.