OPEN-SOURCE SCRIPT
Function 2 Point Line using UNIX TIMESTAMP V1
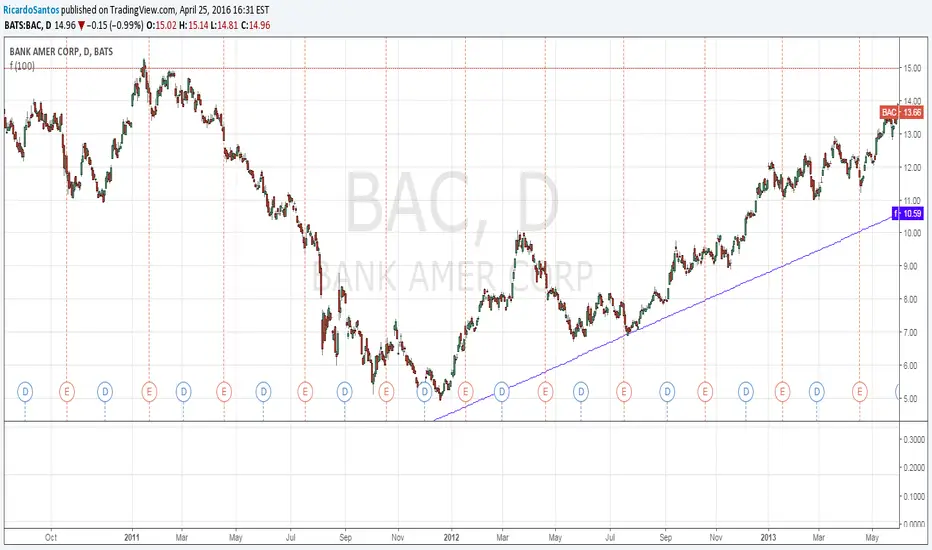
experimental:
draws a line from 2 vectors(price, time)
update:
reformatted the function,
added automatic detection of the period multiplier by approximation(gets a bit goofy with stocks/week time),
example using timestamp() function.
offsetting is still bugged, i cant find a way around it atm.
draws a line from 2 vectors(price, time)
update:
reformatted the function,
added automatic detection of the period multiplier by approximation(gets a bit goofy with stocks/week time),
example using timestamp() function.
offsetting is still bugged, i cant find a way around it atm.
Script de código abierto
Fiel al espíritu de TradingView, el creador de este script lo ha convertido en código abierto, para que los traders puedan revisar y verificar su funcionalidad. ¡Enhorabuena al autor! Aunque puede utilizarlo de forma gratuita, recuerde que la republicación del código está sujeta a nuestras Normas internas.
Exención de responsabilidad
La información y las publicaciones no constituyen, ni deben considerarse como asesoramiento o recomendaciones financieras, de inversión, de trading o de otro tipo proporcionadas o respaldadas por TradingView. Más información en Condiciones de uso.