PROTECTED SOURCE SCRIPT
The Symbol Now [TVC25]

Indicator Description
When selecting a position and analyzing the market price, the existing highs and lows are mainly referred to as support and resistance. Generally, while checking the candle chart, we calculate the fluctuation rate based on the closing price.
If you hold a position or are planning to do so, it's important to identify your risk factors in the short term. However, the decision to liquidate a position is made in a way other than the closing price method.
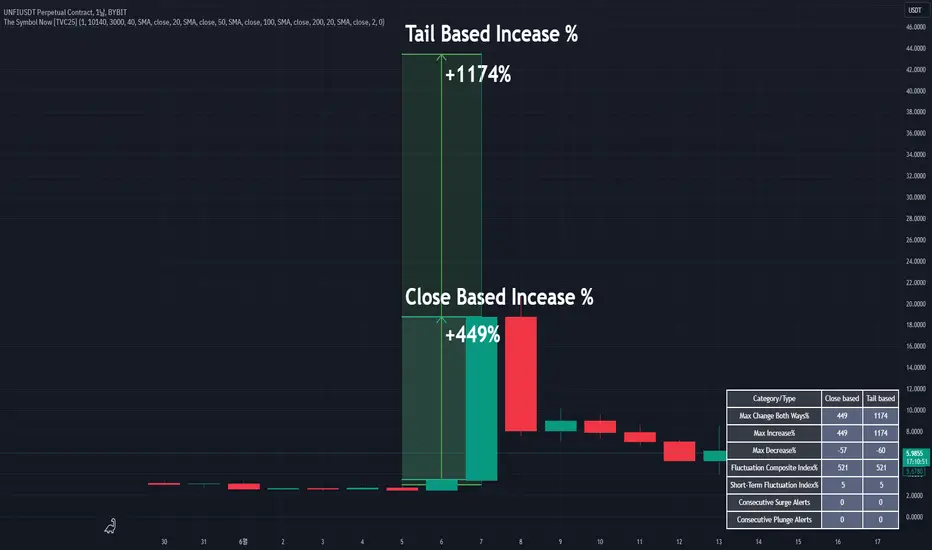
Considering the maximum variation of a candle with a tail, it will help you determine the degree of risk you have to take.
---
Functional description
Check the largest percentage change ever
It checks the maximum market price percentage captured in one of the historical data available based on current stocks and installments.
Check short-term maximum change %
Based on current stocks and installments, we check the maximum market price percentage captured within the last n minutes.
a sense of plunging/riotism
Based on the moving average and the Bollinger band, it detects the collapse/explosiveness.
When the current market price erupts, it tends to deviate from the Bollinger band, and at this time, it is judged as a signal of a crash/riot, considering where the market price is placed relative to the moving average, and a warning sign is displayed on the chart.
--------------------------------Korean--------------------------------
지표 설명
포지션을 선택하고 시세를 분석할 때에는 주로 기존의 최고가와 최저가를 지지와 저항으로 참고합니다. 일반적으로는 캔들 차트를 확인하면서 종가를 기반으로 한 등락률을 계산합니다.
포지션을 보유하거나 계획 중인 경우, 단기적으로 자신이 감당해야 할 위험 요소를 미리 파악하는 것이 중요합니다. 그러나 포지션 청산 결정은 종가 방식으로 결정되어지지는 않습니다.
꼬리가 포함된 캔들의 최대 변동률을 고려하면 자신이 감당해야 할 위험의 정도를 판단하는 데 도움이 될 것입니다.
---
기능설명
역대 최대 변동 % 확인
현재 종목과 분봉을 기준으로 확보가능한 역대 데이터 중 1개 봉에서 포착된 최대 시세%를 확인해 줍니다.
단기 최대 변동 % 확인
현재 종목과 분봉을 기준으로 확보가능한 최근 n분내에 포착된 최대 시세%를 확인해 줍니다.
폭락/폭등 주의 감지
이동평균선과 볼린저밴드를 기반으로 폭락/폭등주의를 감지합니다.
현재 시세가 분출 하는 경우 볼린저 밴드를 이탈하는 경향이 있는데 이 때 시세가 이동평균선 대비 어떤 위치에 배치되어 있는가를 고려하여 폭락/폭등 주의 신호로 판단하고 차트에 주의표시를 표시합니다.
Script protegido
Este script se publica como código cerrado. No obstante, puede utilizarlo libremente y sin ninguna limitación. Obtenga más información aquí.
돈버는 수면단타캠프1기 신청방법
cafe.naver.com/crypto25/
모든 지표를 전략화하는 도구
hub.crypto25.net/view/495069
트레이딩뷰 실전전략&설정값 공유
hub.crypto25.net/
TV Crypto25
youtube.com/@TVC25
cafe.naver.com/crypto25/
모든 지표를 전략화하는 도구
hub.crypto25.net/view/495069
트레이딩뷰 실전전략&설정값 공유
hub.crypto25.net/
TV Crypto25
youtube.com/@TVC25
Exención de responsabilidad
La información y las publicaciones no constituyen, ni deben considerarse como asesoramiento o recomendaciones financieras, de inversión, de trading o de otro tipo proporcionadas o respaldadas por TradingView. Más información en Condiciones de uso.