KD_RSI345
Modified: 2/12/2017
Description:
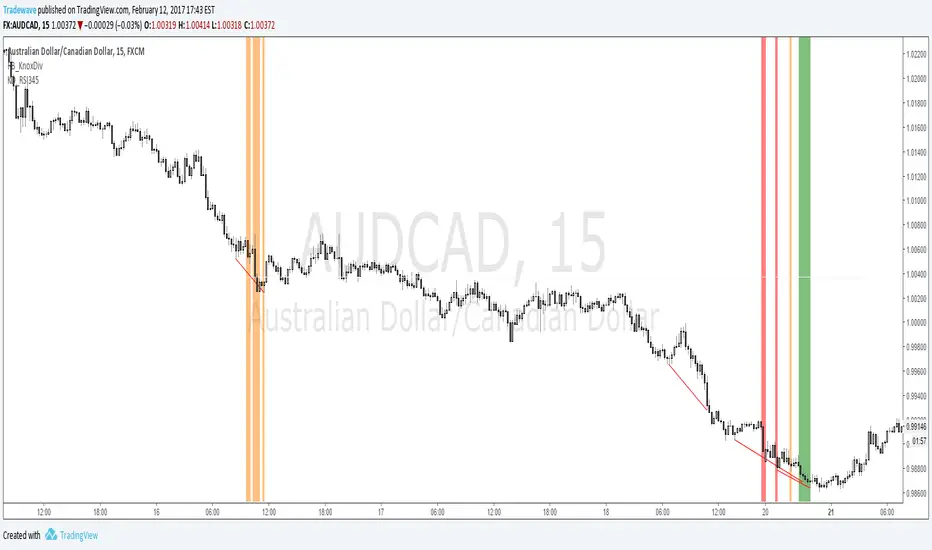
The indicator searches for instances where there is a Knoxville divergence combined with multiple time frame RSI Oversold/Overbought conditions.
When a bullish Knoxville Divergence (KD) is present and price is oversold across 3 time frames, within the KD bar range, a vertical green line is displayed on the chart.
When a bullish Knoxville Divergence (KD) is present and price is oversold across 4 time frames, within the KD bar range, a vertical orange line is displayed on the chart.
When a bullish Knoxville Divergence (KD) is present and price is oversold across 3 time frames, within the KD bar range, a vertical red line is displayed on the chart.
Same applies for Bearish Knoxville Divergence in overbought conditions.
Script que requiere invitación
Solo los usuarios autorizados por el autor pueden acceder a este script. Deberá solicitar y obtener permiso para utilizarlo. Por lo general, este se concede tras realizar el pago. Para obtener más información, siga las instrucciones del autor indicadas a continuación o póngase en contacto directamente con LiquidityTracker.
TradingView NO recomienda pagar por un script ni utilizarlo a menos que confíe plenamente en su autor y comprenda cómo funciona. También puede encontrar alternativas gratuitas y de código abierto en nuestros scripts de la comunidad.
Instrucciones del autor
Exención de responsabilidad
Script que requiere invitación
Solo los usuarios autorizados por el autor pueden acceder a este script. Deberá solicitar y obtener permiso para utilizarlo. Por lo general, este se concede tras realizar el pago. Para obtener más información, siga las instrucciones del autor indicadas a continuación o póngase en contacto directamente con LiquidityTracker.
TradingView NO recomienda pagar por un script ni utilizarlo a menos que confíe plenamente en su autor y comprenda cómo funciona. También puede encontrar alternativas gratuitas y de código abierto en nuestros scripts de la comunidad.