PROTECTED SOURCE SCRIPT
Actualizado EasyTrade - Trend Clouds
Hello Traders!
Starting from an idea of youtube channel "Daily Investments", we have developed this interesting indicator and prepared to be used with the EasyTrade software.
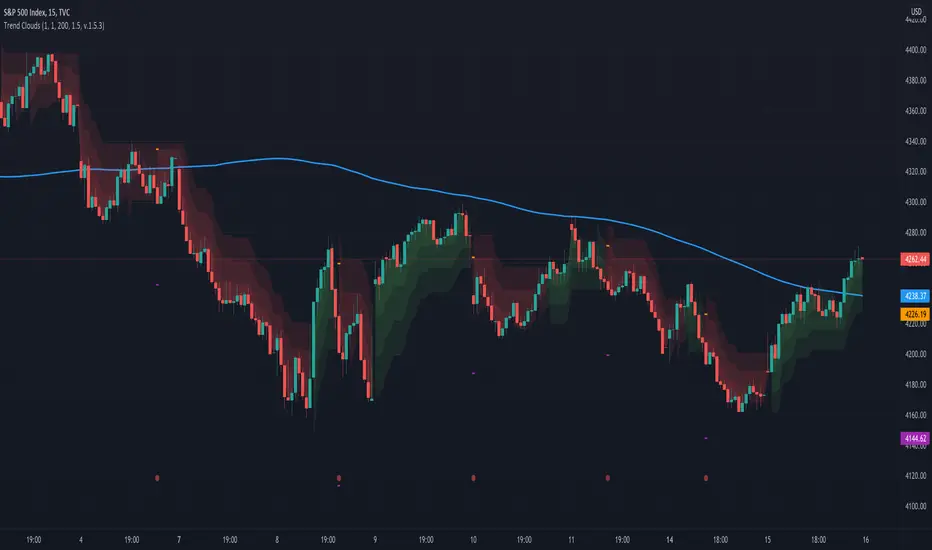
The idea behind this indicator is a combination of 3 SuperTrend suitably configured to overcome the classic problem of SuperTrends, false positives.
In addition to SuperTrends, we have added the ability to "filter trends" using a freely configurable moving average.
Good results are obtained with 15-minute timeframe (see video on credits).

Settings
Reaction : This value is used to adjust the classic "ATR Length" proportionally between the 3 SuperTrends.
Sensibility : This value is used to adjust the classic "Factor" proportionally between the 3 SuperTrends.
Use MA filter and Value : This options Enable/Disable the MA filter. You can change the period of the MA
R/R ratio : You can set your Risk/Reward ratio according to your trading rules.
Show Clouds : Show or hide the indicator cloud
Show Signals : Show or hide the dots on the bottom of the graphs that represents the BUY (Green Point), SELL (Red Point) signals.
Show Clouds : Show or hide Take profits (Purple line) and Stop Loss (Orange Line) value

Alerts
The alert signal generated by the indicator can be directly used by the EasyTrade software to directly execute trades on your preferred Broker.
Conclusion
We hope it will be useful, as it is for us, to simplify and automate your trading, but remember; always do your back-tests with your trading rules.
Suggestions or improvements are always welcome, if they make sense.
Credits
Daily Investments Video
EasyTrade Free Indicators and Software
Starting from an idea of youtube channel "Daily Investments", we have developed this interesting indicator and prepared to be used with the EasyTrade software.
The idea behind this indicator is a combination of 3 SuperTrend suitably configured to overcome the classic problem of SuperTrends, false positives.
In addition to SuperTrends, we have added the ability to "filter trends" using a freely configurable moving average.
Good results are obtained with 15-minute timeframe (see video on credits).
Settings
Reaction : This value is used to adjust the classic "ATR Length" proportionally between the 3 SuperTrends.
Sensibility : This value is used to adjust the classic "Factor" proportionally between the 3 SuperTrends.
Use MA filter and Value : This options Enable/Disable the MA filter. You can change the period of the MA
R/R ratio : You can set your Risk/Reward ratio according to your trading rules.
Show Clouds : Show or hide the indicator cloud
Show Signals : Show or hide the dots on the bottom of the graphs that represents the BUY (Green Point), SELL (Red Point) signals.
Show Clouds : Show or hide Take profits (Purple line) and Stop Loss (Orange Line) value
Alerts
The alert signal generated by the indicator can be directly used by the EasyTrade software to directly execute trades on your preferred Broker.
Conclusion
We hope it will be useful, as it is for us, to simplify and automate your trading, but remember; always do your back-tests with your trading rules.
Suggestions or improvements are always welcome, if they make sense.
Credits
Daily Investments Video
EasyTrade Free Indicators and Software
Notas de prensa
In this version we changed :- The name of the indicator
- Added a new type of Alert dedicated to Crypto fully compatible with our EasyTrade software
Script protegido
Este script se publica como código cerrado. No obstante, puede utilizarlo libremente y sin ninguna limitación. Obtenga más información aquí.
Exención de responsabilidad
La información y las publicaciones no constituyen, ni deben considerarse como asesoramiento o recomendaciones financieras, de inversión, de trading o de otro tipo proporcionadas o respaldadas por TradingView. Más información en Condiciones de uso.