PROTECTED SOURCE SCRIPT
[N]RSIOMA
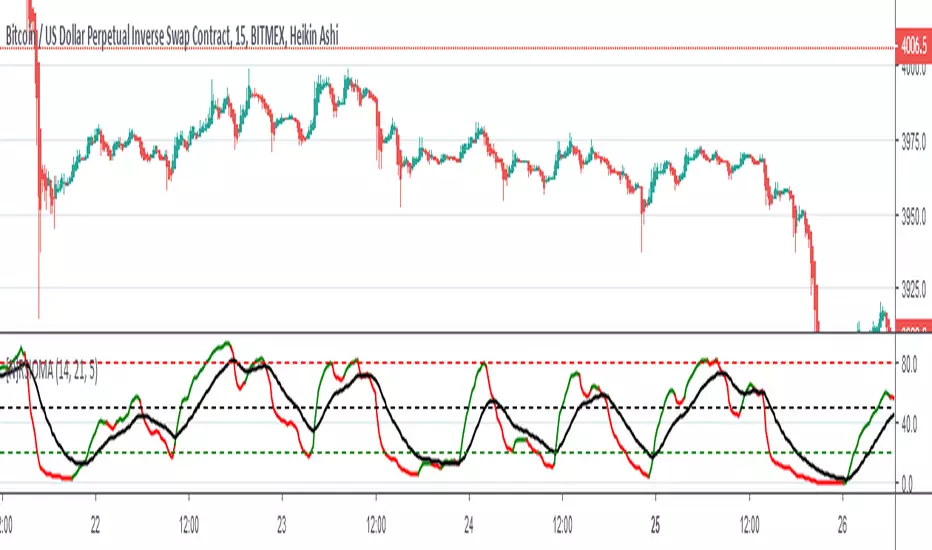
RSIOMA is the abbreviation for Relative Strength index (RSI) of moving averages (MA).
Rules:
RSI above MA and RSI above level 50 is a signal of a bullish trend. RSI below MA and RSI below level 50 is a signal of a bearish trend.
One can also buy when the RSI breaks level 20 from below and sell when RSI breaks level 80 from above
Tip 1: Look out for bounces. When RSI line bounces off from MA line it means the trend will likely continue;
Tip 2: Look out for support / resistance of RSI LINE.
Tip 3: USE as follow = higher timeframe to lower timeframe
Script protegido
Este script se publica como código cerrado. No obstante, puede utilizarlo libremente y sin ninguna limitación. Obtenga más información aquí.
Exención de responsabilidad
La información y las publicaciones no constituyen, ni deben considerarse como asesoramiento o recomendaciones financieras, de inversión, de trading o de otro tipo proporcionadas o respaldadas por TradingView. Más información en Condiciones de uso.