PROTECTED SOURCE SCRIPT
Price Range Deviation
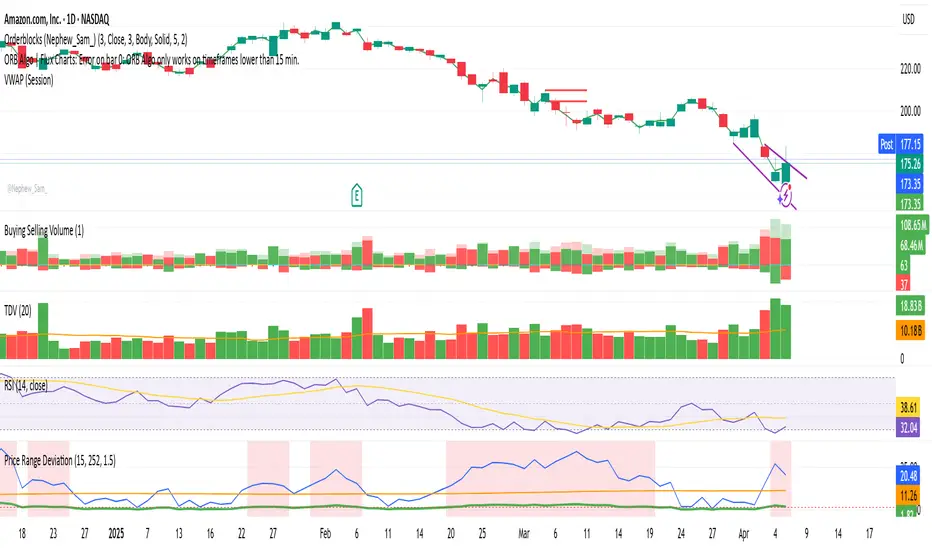
📌 Description: Price Range Deviation Indicator
This indicator measures how much a stock has moved over a recent period (e.g., 15 days) and compares that move to the average move of similar-length windows over a longer lookback period (e.g., 1 year or 252 days).
It helps identify when a stock has made an unusually large move compared to its historical norm — which can signal that the move is overextended.
📊 How It Works:
Recent Move ($): The absolute price change over the selected recent period.
Average Move ($): The average absolute price change over rolling windows of the same size across the full lookback period.
Move Ratio: The current move divided by the average move.
When the move ratio exceeds a custom threshold (e.g., 1.5× the average), the background highlights red to signal that the move is unusually large.
💡 Use Case:
Ideal for options traders looking to:
Identify overextended price moves
Sell out-of-the-money calls or puts beyond a high-move zone
Fade price exhaustion with high probability setups
Script protegido
Este script se publica como código cerrado. No obstante, puede utilizarlo libremente y sin ninguna limitación. Obtenga más información aquí.
Exención de responsabilidad
La información y las publicaciones no constituyen, ni deben considerarse como asesoramiento o recomendaciones financieras, de inversión, de trading o de otro tipo proporcionadas o respaldadas por TradingView. Más información en Condiciones de uso.