OPEN-SOURCE SCRIPT
Actualizado Bollinger Band Volatility Spread Visualizer
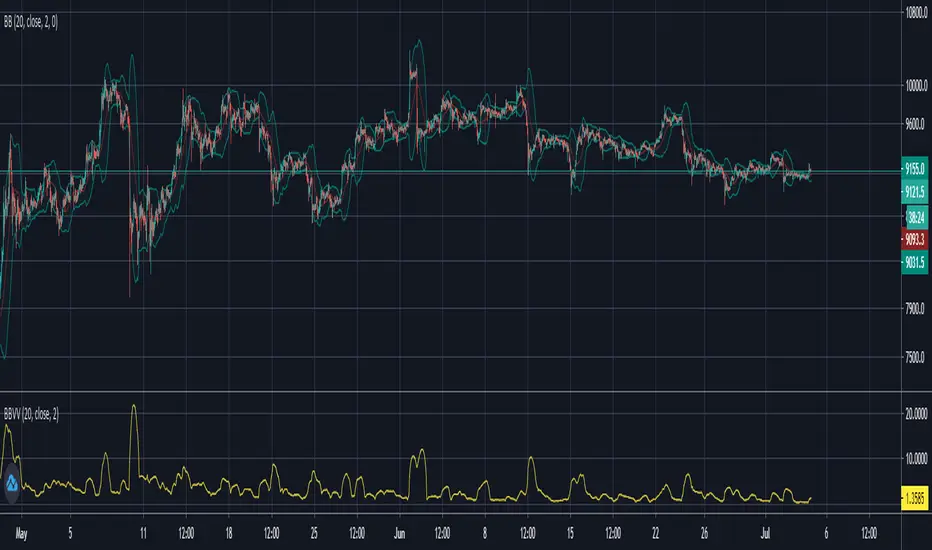
This indicator was created to see the total dollar (or whatever currency pair) amount spread between the upper and lower Bollinger Bands. This knowledge of knowing this spread can be used to indicate upcoming periods of high volatility in a market. The fundamental idea behind predicting periods of high volatility is backed up by the idea that periods of low volatility are followed by periods of high volatility and vice versa.
Based on this knowledge, the numerical spread of the Bollinger Bands, as shown in the indicator, we can deduce that when the value is super low, we can expect a period of high volatility AKA: big move incoming.
This indicator is not fully finished because this was my first time coding in Pinescript and I wanted to post the basic indicator first.
My future plans for improving this indicator include:
- Adding customization as an option to choose your personal BBands settings that this indicator is based off of
- Potentially converting this indicator as a TradingView Strategy where a signal would go off when the spread reaches a certain threshold
Notas de prensa
Added code for custom Bollinger Bands input for flexibility for everyone's different uses of Bollinger BandsNotas de prensa
Changed the way the data is presented by indexing the spread of the Bollinger Bands relative to the price of the asset. Basically just used the Bollinger Bands Width function that already exists and multiplied by 100 to get more precision. My eventual goal is to figure out a threshold that when reached, creates a general signal of upcoming high volatility. That signal can then be used in conjunction with other indicators (to detect the direction of a trend) to create a buy or sell signal.
Script de código abierto
Fiel al espíritu de TradingView, el creador de este script lo ha convertido en código abierto, para que los traders puedan revisar y verificar su funcionalidad. ¡Enhorabuena al autor! Aunque puede utilizarlo de forma gratuita, recuerde que la republicación del código está sujeta a nuestras Normas internas.
Exención de responsabilidad
La información y las publicaciones no constituyen, ni deben considerarse como asesoramiento o recomendaciones financieras, de inversión, de trading o de otro tipo proporcionadas o respaldadas por TradingView. Más información en Condiciones de uso.