OPEN-SOURCE SCRIPT
Relative Volume Standard Deviation
The Relative Volume Standard Deviation indicator is a powerful tool designed for traders seeking insights into volume dynamics. This indicator assesses the deviation of a security's trading volume from its moving average, shedding light on potential shifts in market sentiment.
Key Features:
-Length: Tailor the indicator's sensitivity by adjusting the length of the moving average.
-Number of Deviations: Customize the analysis by specifying the number of standard deviations to consider.
-Show Negative Values: Toggle the visibility of negative values in the plot for a comprehensive view.
How it Works:
-Moving Average Calculation: The script computes the simple moving average (SMA) of the trading volume over the specified length, providing a baseline for comparison.
-Standard Deviation Analysis: It calculates the standard deviation of the volume, identifying deviations from the average volume.
-Relative Volume Standard Deviation: The indicator then normalizes the difference between the volume and its moving average by the calculated standard deviation, producing a relative measure of volume deviation.
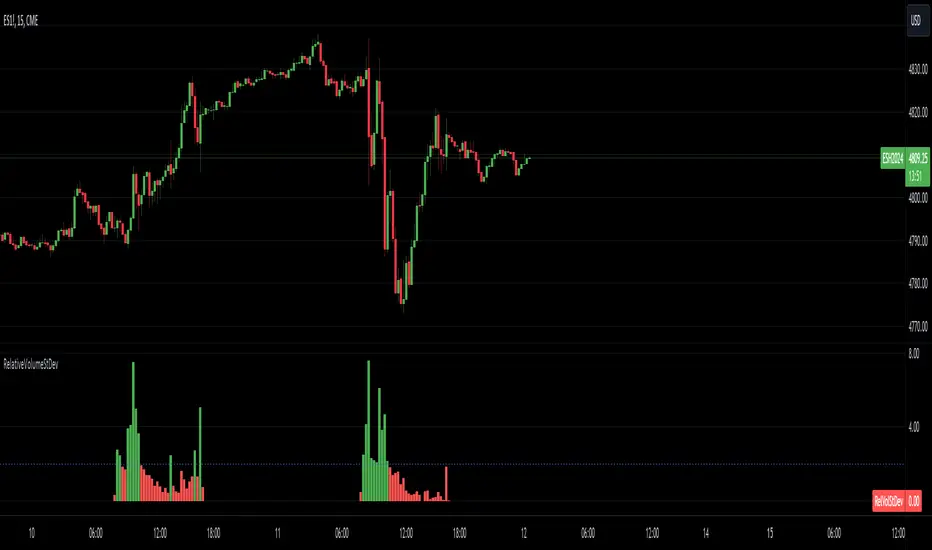
-Visual Representation: The result is visually represented on the chart using columns. Green columns signify relative volume standard deviation values greater than or equal to the specified number of deviations, while red columns represent values below this threshold.
-Enhancements:
Show Deviation Level: Optionally, a dashed horizontal line at the specified deviation level adds an extra layer of analysis, aiding in the identification of significant deviations.
Key Features:
-Length: Tailor the indicator's sensitivity by adjusting the length of the moving average.
-Number of Deviations: Customize the analysis by specifying the number of standard deviations to consider.
-Show Negative Values: Toggle the visibility of negative values in the plot for a comprehensive view.
How it Works:
-Moving Average Calculation: The script computes the simple moving average (SMA) of the trading volume over the specified length, providing a baseline for comparison.
-Standard Deviation Analysis: It calculates the standard deviation of the volume, identifying deviations from the average volume.
-Relative Volume Standard Deviation: The indicator then normalizes the difference between the volume and its moving average by the calculated standard deviation, producing a relative measure of volume deviation.
-Visual Representation: The result is visually represented on the chart using columns. Green columns signify relative volume standard deviation values greater than or equal to the specified number of deviations, while red columns represent values below this threshold.
-Enhancements:
Show Deviation Level: Optionally, a dashed horizontal line at the specified deviation level adds an extra layer of analysis, aiding in the identification of significant deviations.
Script de código abierto
Fiel al espíritu de TradingView, el creador de este script lo ha convertido en código abierto, para que los traders puedan revisar y verificar su funcionalidad. ¡Enhorabuena al autor! Aunque puede utilizarlo de forma gratuita, recuerde que la republicación del código está sujeta a nuestras Normas internas.
Exención de responsabilidad
La información y las publicaciones no constituyen, ni deben considerarse como asesoramiento o recomendaciones financieras, de inversión, de trading o de otro tipo proporcionadas o respaldadas por TradingView. Más información en Condiciones de uso.