OPEN-SOURCE SCRIPT
Actualizado Multi Candle Body Mapper
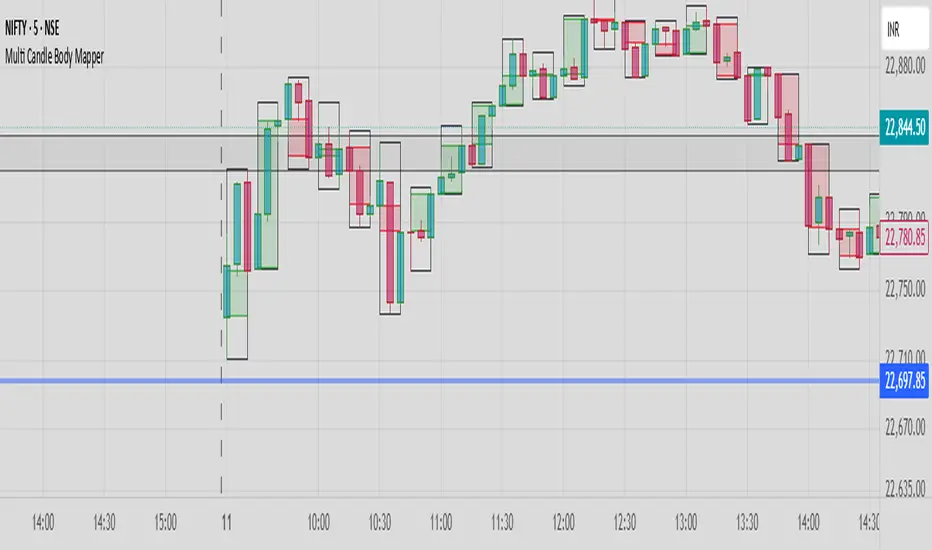
Multi Candle Body Mapper
Visualize higher-timeframe candle structure within lower timeframes — without switching charts.
This tool maps grouped candle bodies and wicks (e.g., 15min candles on a 5min chart) using precise boxes and lines. Ideal for intraday traders who want to analyze market intent, body bias, and wick rejection in a compressed, organized view.
Features:
Visualize 3, 6, or 12 candle groups (e.g., 15min / 30min / 1H views)
Body box shows bullish/bearish color with adjustable transparency
Wick box shows high-low range with adjustable thickness and color
Dashed line at group close level for market direction hint
Full color customization
Toggle individual elements ON/OFF
Clean overlay – doesn’t interfere with price candles
Great for spotting:
Hidden support/resistance
Momentum buildup
Reversal traps and continuation setups
Keep your chart simple but smarter — all without changing your timeframe.
Notas de prensa
Multi Candle Body MapperVisualize higher-timeframe candle structure within lower timeframes — without switching charts.
This tool maps grouped candle bodies and wicks (e.g., 15min candles on a 5min chart) using precise boxes and lines. Ideal for intraday traders who want to analyze market intent, body bias, and wick rejection in a compressed, organized view.
Features:
Visualize 3, 6, or 12 candle groups (e.g., 15min / 30min / 1H views)
Body box shows bullish/bearish color with adjustable transparency
Wick box shows high-low range with adjustable thickness and color
Dashed line at group close level for market direction hint
Full color customization
Toggle individual elements ON/OFF
Clean overlay – doesn’t interfere with price candles
Great for spotting:
Hidden support/resistance
Momentum buildup
Reversal traps and continuation setups
Keep your chart simple but smarter — all without changing your timeframe.
Script de código abierto
Fiel al espíritu de TradingView, el creador de este script lo ha convertido en código abierto, para que los traders puedan revisar y verificar su funcionalidad. ¡Enhorabuena al autor! Aunque puede utilizarlo de forma gratuita, recuerde que la republicación del código está sujeta a nuestras Normas internas.
Exención de responsabilidad
La información y las publicaciones no constituyen, ni deben considerarse como asesoramiento o recomendaciones financieras, de inversión, de trading o de otro tipo proporcionadas o respaldadas por TradingView. Más información en Condiciones de uso.