PROTECTED SOURCE SCRIPT
Momentum imbalance (internal liquidity) by CU
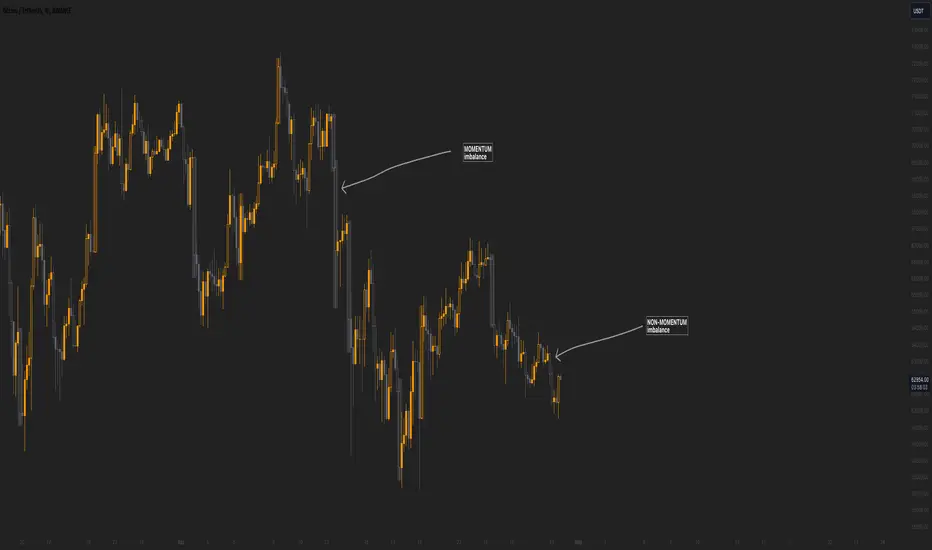
We have developed a sophisticated indicator to detect momentum, imbalance, and internal liquidity within financial markets. Designed to leverage real-time data analysis, this tool aims to assist traders in making more informed decisions.
The momentum component of the indicator calculates the rate at which prices move. By measuring price changes over a specific period, the indicator can show whether an asset is likely to continue rising or falling. This helps traders identify when a trend is gaining strength or beginning to wane.
Market imbalance is analyzed by observing the disparity in buy and sell orders. Our indicator identifies significant deviations between supply and demand, which can indicate potential turning points or accelerations in market movement. This aspect is crucial for understanding the underlying forces that influence price changes.
Regarding internal liquidity, our indicator measures the market depth and the availability of liquid assets. This component is essential for assessing how easily assets can be bought or sold without significantly impacting the price. High internal liquidity indicates a healthy market where transactions are executed quickly and efficiently, while low liquidity can lead to increased volatility and potential price manipulation.
By integrating these three components, our indicator provides a holistic view of market dynamics, enabling traders to operate more strategically and with greater confidence.
Script protegido
Este script se publica como código cerrado. However, you can use it freely and without any limitations – learn more here.
Exención de responsabilidad
The information and publications are not meant to be, and do not constitute, financial, investment, trading, or other types of advice or recommendations supplied or endorsed by TradingView. Read more in the Terms of Use.