OPEN-SOURCE SCRIPT
Actualizado Trading Range Aggression Histogram

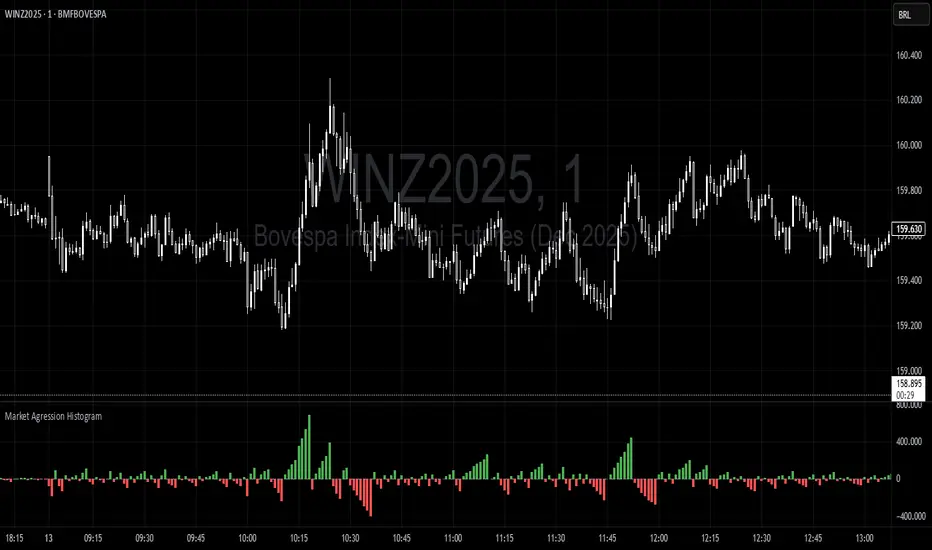
This indicator is a histogram that accumulates the net volume of aggressive buying and selling per candle, representing the dominant market pressure within defined time-frame.
The indicator works by continuously summing volumes as long as the aggression remains in the same direction, resetting and reversing the accumulation when the pressure changes sides.
This creates visual waves that facilitate the perception of phases dominated by buyers and sellers over time. The tool is useful to identify moments of strength, weakness, and potential reversals in a dynamic market, especially in short-term trading.
Notas de prensa
This indicator is a histogram that accumulates the net volume of aggressive buying and selling per candle, representing the dominant market pressure within defined time-frame.The indicator works by continuously summing volumes as long as the aggression remains in the same direction, resetting and reversing the accumulation when the pressure changes sides.
This creates visual waves that facilitate the perception of phases dominated by buyers and sellers over time. The tool is useful to identify moments of strength, weakness, and potential reversals in a dynamic market, especially in short-term trading.
Script de código abierto
Fiel al espíritu de TradingView, el creador de este script lo ha convertido en código abierto, para que los traders puedan revisar y verificar su funcionalidad. ¡Enhorabuena al autor! Aunque puede utilizarlo de forma gratuita, recuerde que la republicación del código está sujeta a nuestras Normas internas.
Exención de responsabilidad
La información y las publicaciones no constituyen, ni deben considerarse como asesoramiento o recomendaciones financieras, de inversión, de trading o de otro tipo proporcionadas o respaldadas por TradingView. Más información en Condiciones de uso.