Multi-Timeframe High/Low/Close Levels (H1–H4–D–W–M)
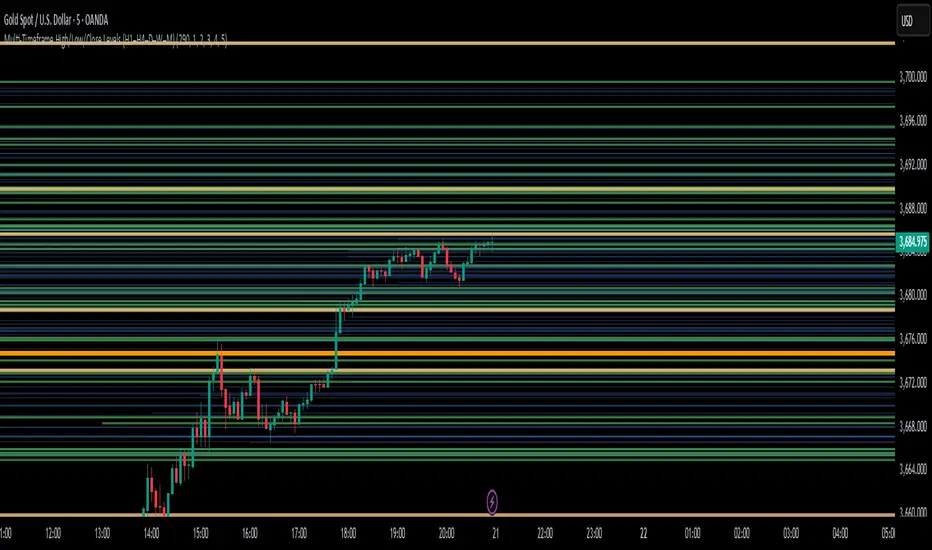
H1 (1-Hour)
H4 (4-Hour)
Daily (1-Day)
Weekly (1-Week)
Monthly (1-Month)
Key Features:
Draws High, Low, and Close levels for each timeframe.
Each level starts from its own candle and extends to the right.
Levels are filtered to stay close to the current price, keeping the chart clean.
Automatic line management ensures that the total number of levels never exceeds the user-defined limit (default: 300, adjustable up to 400).
Customizable colors, widths, and visibility for each timeframe in the Style tab.
Usage:
Use these levels as dynamic support and resistance zones.
Higher-timeframe levels are drawn with stronger colors and thicker lines, giving visual priority over lower-timeframe levels.
Script que requiere invitación
Solo los usuarios autorizados por el autor pueden acceder a este script. Deberá solicitar y obtener permiso para utilizarlo. Por lo general, este se concede tras realizar el pago. Para obtener más información, siga las instrucciones del autor indicadas a continuación o póngase en contacto directamente con Vahid_Sehat.
TradingView NO recomienda pagar por un script ni utilizarlo a menos que confíe plenamente en su autor y comprenda cómo funciona. También puede encontrar alternativas gratuitas y de código abierto en nuestros scripts de la comunidad.
Instrucciones del autor
Exención de responsabilidad
Script que requiere invitación
Solo los usuarios autorizados por el autor pueden acceder a este script. Deberá solicitar y obtener permiso para utilizarlo. Por lo general, este se concede tras realizar el pago. Para obtener más información, siga las instrucciones del autor indicadas a continuación o póngase en contacto directamente con Vahid_Sehat.
TradingView NO recomienda pagar por un script ni utilizarlo a menos que confíe plenamente en su autor y comprenda cómo funciona. También puede encontrar alternativas gratuitas y de código abierto en nuestros scripts de la comunidad.