PROTECTED SOURCE SCRIPT
Actualizado SMC Community [algoat] — Smart Money Concepts
Empower your trading with the core principles of the Smart Money Concepts through interactive features and highly customizable settings.
The indicator's strength lies in the unique SMC Core algorithm, a calculation based on real price action data, capturing every tick from small intraday fluctuations to significant high timeframe movements.
⭐ Key Features
Swing Market Structure: Change of Character, Break of Structure
Recognize and visualize real-time market structures with swing elements. Identify and mark key structural changes in the market to visually highlight shifts in market trends and patterns. This feature is designed to alert you to significant changes in the market's behavior, signaling a potential shift from accumulation to distribution phases, or vice versa. It helps traders adapt their strategies based on evolving market dynamics.
Order Flow: Structure Fractal
Connect the successive structural high and low levels, visualizing the intricate flow of market movements. This feature highlights fractal structures within the market, enabling traders to detect significant price action patterns.

Structure Range: Determine Discount, Premium, and Equilibrium Zones
This feature provides a unique way of visualizing price areas where a security could be overbought or oversold (premium or discount zones) and where the price is expected to be fair and balanced (equilibrium zone). Distance from the current price is displayed in percentage terms, which can assist traders with crucial data for risk management and strategic planning. The Range function helps you identify the most favorable price zones for entries and set your stop-loss and take-profit levels more accurately.
Liquidity Grabs: Reveal Hidden Manipulation Attempts
Identify uncovered market areas where high liquidity trading may take place. Liquidity Grabs help track "smart money" footprints by identifying levels where large institutional traders may have induced liquidity traps. Understanding these traps can aid in avoiding false market moves and optimizing trade entries.

Institutional Interest Zones: Order Blocks and Fair Value Gaps
Uncover areas where bigger orders may be lined up. Reveal zones of interest ordered by volume strength. Receive warnings about market price imbalances.
══════════════════
⭐ Why SMC?
In the ever-evolving trading landscape, mainstream methods and strategies can quickly become outdated as they are widely adopted. Liquidity is constantly sought after, and the best source for this is exploring and exploiting trading strategies that are widely accepted and applied. Currently, one of these strategies is the SMC (Supply, Demand, and Price Action).
It's no coincidence that our educational materials incorporate concepts such as liquidity grabs (LG) and Smart Money Traps (SMT). As the application of SMC gains popularity among retail traders, trading with this approach becomes more challenging. Therefore, the recent focus has been on reforming the SMC methodology, as it is the only method that relies on real price movements and will always work when applied correctly.
The indicator reflects our personal use and deep comprehension of Smart Money Concepts. It provides streamlined tools for tracking algorithmic trends with modern visualizations, without unnecessary clutter.
▸ What does the proper application of SMC entail?
Many SMC traders associate their key areas of interest with the market structure, which is generally considered acceptable. However, depending solely on a single foundation can lead to significant deviations, which may cause notable impacts on trading results. Moreover, if the basis for the market structure calculation is inaccurate, the consequences can be even more severe. It's akin to risking money on a lottery ticket, believing it will be a winner.
Our methodology is different, and it may ensure longevity in the financial markets. The structure remains crucial, but it is not the sole foundation of everything; instead, it serves as a validation tool. Each calculation, such as order blocks (OB), Fair Value Gaps (FVG), liquidity grabs (LG), range analysis, and more, is independent and unique, separate from the structure. However, validation must ultimately come from the structure itself.
We employ individual and high-quality filters: before a function calculation is validated by the structure, it must undergo rigorous testing based on its own set of validation conditions. This approach aims to enhance robustness and accuracy, providing traders with a reliable framework for making informed trading decisions.
▸ An example of structure validation: Order Block with "Swing Sensitivity"
These order blocks will only be displayed and utilized by the script if there is a swing structure validation with a valid break. In other words, the presence of a confirmed swing Change of Character (ChoCh) or Break of Structure (BoS) is essential for the Order Block to be considered valid and relevant.
This approach ensures that the order blocks are aligned with the overall market structure and are not based on isolated or unreliable price movements. Whether it's Fair Value Gaps (FVG), Liquidity Grabs (LG), Range calculations, or other functionalities, the same underlying principle holds true. The background structure calculation serves as a validation mechanism for the data and insights generated by these functions, ensuring they adhere to the specific criteria and rules established within our methodology. By incorporating this robust validation process, traders can have confidence in the reliability and accuracy of the information provided by the indicator, allowing them to make informed trading decisions based on validated data and analysis.
══════════════════
👉 Usage - the general approach
Determine your trading style and build your basic strategy:
The indicator helps you understand your trading style, whether it's swing trading, scalping or another approach. By analyzing the SMC indicator, you gain valuable information about potential market trends, entry and exit points, and overall market sentiment.
Steps:
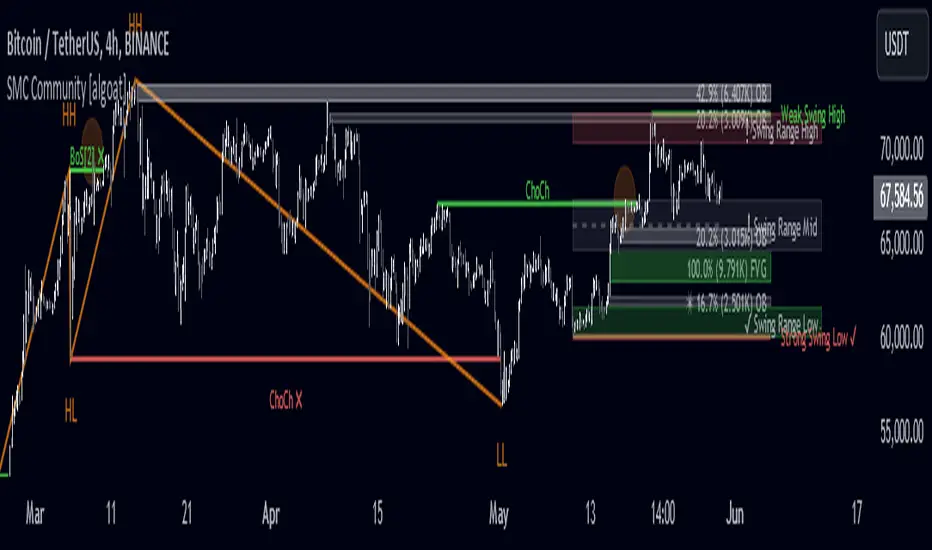
👉 Example of usage
In the following chart, you'll notice how we've utilized the indicator to formulate a strategic trading approach. We've employed Order Blocks equipped with volume parameters to identify crucial market zones. Simultaneously, we've leveraged swing/internal market structures to gain insights into potential long- and short-term market turnarounds. Lastly, we've examined trend line liquidity zones to pinpoint probable impulses and breakouts within ongoing trends.

Now we can see how the price descended to the order block with the highest volume, which we had previously marked as our point of interest for an entry. As the price closed below the median Order Block, we noted its mitigation. After an internal CHoCH, it's directing us towards the main Order Block as a target.

══════════════════
🧠 General advice
Trading effectively requires a range of techniques, experience, and expertise. From technical analysis to market fundamentals, traders must navigate multiple factors, including market sentiment and economic conditions. However, traders often find themselves overwhelmed by market noise, making it challenging to filter out distractions and make informed decisions. By integrating multiple analytical approaches, traders can tailor their strategies to fit their unique trading styles and objectives.
Confirming signals with other indicators
As with all technical indicators, it is important to confirm potential signals with other analytical tools, such as support and resistance levels, as well as indicators like RSI, MACD, and volume. This helps increase the probability of a successful trade.
Use proper risk management
When using this or any other indicator, it is crucial to have proper risk management in place. Consider implementing stop-loss levels and thoughtful position sizing.
Combining with other technical indicators
Integrate this indicator with other technical indicators to develop a comprehensive trading strategy and provide additional confirmation.
Conduct Thorough Research and Backtesting
Ensure a solid understanding of the indicator and its behavior through thorough research and backtesting before making trading decisions. Consider incorporating fundamental analysis and market sentiment into your trading approach.
══════════════════
⭐ Conclusion
We hold the view that the true path to success is the synergy between the trader and the tool, contrary to the common belief that the tool itself is the sole determinant of profitability. The actual scenario is more nuanced than such an oversimplification. A word to the wise is enough: developed by traders, for traders — pioneering innovations for the modern era.
Risk Notice
Everything provided by algoat — from scripts, tools, and articles to educational materials — is intended solely for educational and informational purposes. Past performance does not assure future returns.
The indicator's strength lies in the unique SMC Core algorithm, a calculation based on real price action data, capturing every tick from small intraday fluctuations to significant high timeframe movements.
- *algoat SMC Core is our continually evolving, specialized structure mapping algorithm, serving as the backbone of our price action related publications.
⭐ Key Features
Swing Market Structure: Change of Character, Break of Structure
Recognize and visualize real-time market structures with swing elements. Identify and mark key structural changes in the market to visually highlight shifts in market trends and patterns. This feature is designed to alert you to significant changes in the market's behavior, signaling a potential shift from accumulation to distribution phases, or vice versa. It helps traders adapt their strategies based on evolving market dynamics.
Order Flow: Structure Fractal
Connect the successive structural high and low levels, visualizing the intricate flow of market movements. This feature highlights fractal structures within the market, enabling traders to detect significant price action patterns.
Structure Range: Determine Discount, Premium, and Equilibrium Zones
This feature provides a unique way of visualizing price areas where a security could be overbought or oversold (premium or discount zones) and where the price is expected to be fair and balanced (equilibrium zone). Distance from the current price is displayed in percentage terms, which can assist traders with crucial data for risk management and strategic planning. The Range function helps you identify the most favorable price zones for entries and set your stop-loss and take-profit levels more accurately.
Liquidity Grabs: Reveal Hidden Manipulation Attempts
Identify uncovered market areas where high liquidity trading may take place. Liquidity Grabs help track "smart money" footprints by identifying levels where large institutional traders may have induced liquidity traps. Understanding these traps can aid in avoiding false market moves and optimizing trade entries.
Institutional Interest Zones: Order Blocks and Fair Value Gaps
Uncover areas where bigger orders may be lined up. Reveal zones of interest ordered by volume strength. Receive warnings about market price imbalances.
▸ Order Blocks pinpoint crucial zones where large institutional investors ("smart money") have shown strong buying or selling interest recently. These blocks can serve as a tool for identifying key areas for potential trade entries or exits.
▸ Fair Value Gaps detect discrepancies between the perceived market value and the actual market price, revealing potential areas for price correction. With its mitigation settings, you can fine-tune the FVG detection according to the magnitude of value misalignment you consider significant.
Mitigation types dictate how price interacts with a zone, with order blocks requiring a close through (indicating stronger price movement) and fair value gaps requiring a wick through (hinting at weak rejection).
══════════════════
⭐ Why SMC?
In the ever-evolving trading landscape, mainstream methods and strategies can quickly become outdated as they are widely adopted. Liquidity is constantly sought after, and the best source for this is exploring and exploiting trading strategies that are widely accepted and applied. Currently, one of these strategies is the SMC (Supply, Demand, and Price Action).
It's no coincidence that our educational materials incorporate concepts such as liquidity grabs (LG) and Smart Money Traps (SMT). As the application of SMC gains popularity among retail traders, trading with this approach becomes more challenging. Therefore, the recent focus has been on reforming the SMC methodology, as it is the only method that relies on real price movements and will always work when applied correctly.
The indicator reflects our personal use and deep comprehension of Smart Money Concepts. It provides streamlined tools for tracking algorithmic trends with modern visualizations, without unnecessary clutter.
▸ What does the proper application of SMC entail?
Many SMC traders associate their key areas of interest with the market structure, which is generally considered acceptable. However, depending solely on a single foundation can lead to significant deviations, which may cause notable impacts on trading results. Moreover, if the basis for the market structure calculation is inaccurate, the consequences can be even more severe. It's akin to risking money on a lottery ticket, believing it will be a winner.
Our methodology is different, and it may ensure longevity in the financial markets. The structure remains crucial, but it is not the sole foundation of everything; instead, it serves as a validation tool. Each calculation, such as order blocks (OB), Fair Value Gaps (FVG), liquidity grabs (LG), range analysis, and more, is independent and unique, separate from the structure. However, validation must ultimately come from the structure itself.
We employ individual and high-quality filters: before a function calculation is validated by the structure, it must undergo rigorous testing based on its own set of validation conditions. This approach aims to enhance robustness and accuracy, providing traders with a reliable framework for making informed trading decisions.
▸ An example of structure validation: Order Block with "Swing Sensitivity"
These order blocks will only be displayed and utilized by the script if there is a swing structure validation with a valid break. In other words, the presence of a confirmed swing Change of Character (ChoCh) or Break of Structure (BoS) is essential for the Order Block to be considered valid and relevant.
This approach ensures that the order blocks are aligned with the overall market structure and are not based on isolated or unreliable price movements. Whether it's Fair Value Gaps (FVG), Liquidity Grabs (LG), Range calculations, or other functionalities, the same underlying principle holds true. The background structure calculation serves as a validation mechanism for the data and insights generated by these functions, ensuring they adhere to the specific criteria and rules established within our methodology. By incorporating this robust validation process, traders can have confidence in the reliability and accuracy of the information provided by the indicator, allowing them to make informed trading decisions based on validated data and analysis.
══════════════════
👉 Usage - the general approach
Determine your trading style and build your basic strategy:
The indicator helps you understand your trading style, whether it's swing trading, scalping or another approach. By analyzing the SMC indicator, you gain valuable information about potential market trends, entry and exit points, and overall market sentiment.
Steps:
- Identify Trading Style: Determine whether you are a swing trader, scalper, or long-term investor. This will influence how you use the indicator.
- Analyze Market Trends: Use the SMC indicator to observe market trends and identify potential entry and exit points.
- Adapt Strategies: Adjust your strategies based on the market dynamics revealed by the SMC indicator, such as changes in order flow or market structure.
👉 Example of usage
In the following chart, you'll notice how we've utilized the indicator to formulate a strategic trading approach. We've employed Order Blocks equipped with volume parameters to identify crucial market zones. Simultaneously, we've leveraged swing/internal market structures to gain insights into potential long- and short-term market turnarounds. Lastly, we've examined trend line liquidity zones to pinpoint probable impulses and breakouts within ongoing trends.
Now we can see how the price descended to the order block with the highest volume, which we had previously marked as our point of interest for an entry. As the price closed below the median Order Block, we noted its mitigation. After an internal CHoCH, it's directing us towards the main Order Block as a target.
══════════════════
🧠 General advice
Trading effectively requires a range of techniques, experience, and expertise. From technical analysis to market fundamentals, traders must navigate multiple factors, including market sentiment and economic conditions. However, traders often find themselves overwhelmed by market noise, making it challenging to filter out distractions and make informed decisions. By integrating multiple analytical approaches, traders can tailor their strategies to fit their unique trading styles and objectives.
Confirming signals with other indicators
As with all technical indicators, it is important to confirm potential signals with other analytical tools, such as support and resistance levels, as well as indicators like RSI, MACD, and volume. This helps increase the probability of a successful trade.
Use proper risk management
When using this or any other indicator, it is crucial to have proper risk management in place. Consider implementing stop-loss levels and thoughtful position sizing.
Combining with other technical indicators
Integrate this indicator with other technical indicators to develop a comprehensive trading strategy and provide additional confirmation.
Conduct Thorough Research and Backtesting
Ensure a solid understanding of the indicator and its behavior through thorough research and backtesting before making trading decisions. Consider incorporating fundamental analysis and market sentiment into your trading approach.
══════════════════
⭐ Conclusion
We hold the view that the true path to success is the synergy between the trader and the tool, contrary to the common belief that the tool itself is the sole determinant of profitability. The actual scenario is more nuanced than such an oversimplification. A word to the wise is enough: developed by traders, for traders — pioneering innovations for the modern era.
Risk Notice
Everything provided by algoat — from scripts, tools, and articles to educational materials — is intended solely for educational and informational purposes. Past performance does not assure future returns.
Notas de prensa
Performance and calculations:- FVG and OB performance increase by up to ~400%, with better accuracy.
- FVG with Volume aggregations.
Customization and Style:
- Display offsets (prevent overlap).
- Display extensions (for backtest).
- Volume display (on/off).
- Box text display (on/off).
- Line text display (on/off).
- Zone names. More tooltips.
Notas de prensa
v3.1 — SMC Core and TMC algorithm update: sensitivity adjustments.Script protegido
Este script se publica como código cerrado. No obstante, puede utilizarlo libremente y sin ninguna limitación. Obtenga más información aquí.
Exención de responsabilidad
La información y las publicaciones no constituyen, ni deben considerarse como asesoramiento o recomendaciones financieras, de inversión, de trading o de otro tipo proporcionadas o respaldadas por TradingView. Más información en Condiciones de uso.
Script protegido
Este script se publica como código cerrado. No obstante, puede utilizarlo libremente y sin ninguna limitación. Obtenga más información aquí.
Exención de responsabilidad
La información y las publicaciones no constituyen, ni deben considerarse como asesoramiento o recomendaciones financieras, de inversión, de trading o de otro tipo proporcionadas o respaldadas por TradingView. Más información en Condiciones de uso.