OPEN-SOURCE SCRIPT
X 4H OR
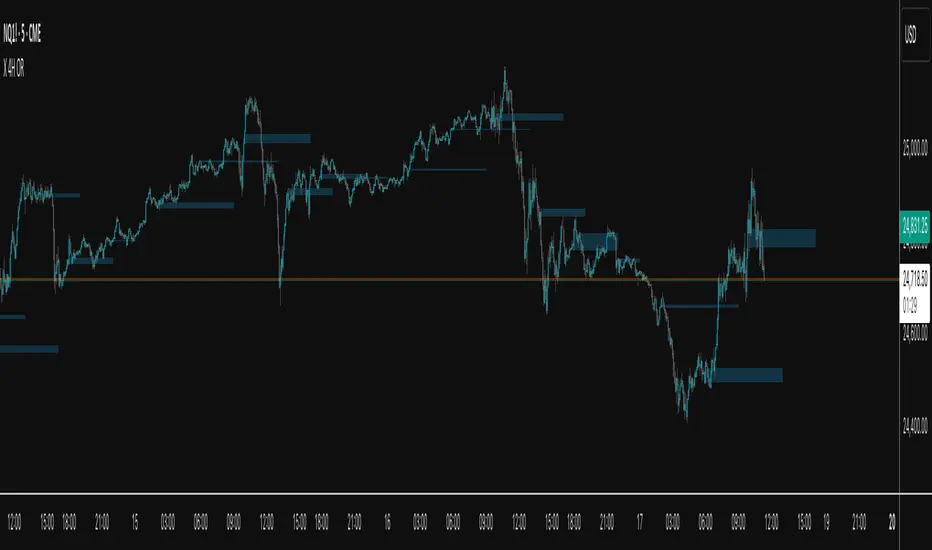
This indicator plots the 30-second opening range (high/low) for six New-York–time anchors—2am, 6am, 10am, 2pm, 6pm, and 10pm—and extends each box to a fixed end time (e.g., 2am→9am, 6am→1pm, etc.). It samples true 30-second data regardless of the chart timeframe, so the captured highs/lows are precise.
What it does
Builds the first 30s OR for each selected anchor and draws a time-anchored box for that session.
Archives every day’s boxes (up to a cap) so you can study how price interacts with past ranges.
Adds per-anchor show toggles to display the latest box for that anchor.
Adds a global History toggle to show/hide all archived boxes without deleting them (clean view vs. context view).
Uses borderless, color-coded fills per anchor to avoid edge distortion while keeping levels easy to read.
Why it’s useful
Quickly spot session inflection zones where liquidity, breakouts, or reversals cluster.
Compare how current price trades relative to recent session ranges for bias and risk framing.
Perform lightweight post-session review/backtesting on OR breaks, retests, and range rotations.
Keep charts decluttered on demand (latest only), or flip on history for deeper context.
Script de código abierto
Fiel al espíritu de TradingView, el creador de este script lo ha convertido en código abierto, para que los traders puedan revisar y verificar su funcionalidad. ¡Enhorabuena al autor! Aunque puede utilizarlo de forma gratuita, recuerde que la republicación del código está sujeta a nuestras Normas internas.
Exención de responsabilidad
La información y las publicaciones no constituyen, ni deben considerarse como asesoramiento o recomendaciones financieras, de inversión, de trading o de otro tipo proporcionadas o respaldadas por TradingView. Más información en Condiciones de uso.