OPEN-SOURCE SCRIPT
Actualizado [SGM VaR Stats VS Empirical]
Main Functions
Logarithmic Returns & Historical Data
Calculates logarithmic returns from closing prices.
Stores these returns in a dynamic array with a configurable maximum size.
Approximation of the Inverse Error Function
Uses an approximation of the erfinv function to calculate z-scores for given confidence levels.
Basic Statistics
Mean: Calculates the average of the data in the array.
Standard Deviation: Measures the dispersion of returns.
Median: Provides a more robust measure of central tendency for skewed distributions.
Z-Score: Converts a confidence level into a standard deviation multiplier.
Empirical vs. Statistical Projection
Empirical Projection
Based on the median of cumulative returns for each projected period.
Applies an adjustable confidence filter to exclude extreme values.
Statistical Projection
Relies on the mean and standard deviation of historical returns.
Incorporates a standard deviation multiplier for confidence-adjusted projections.
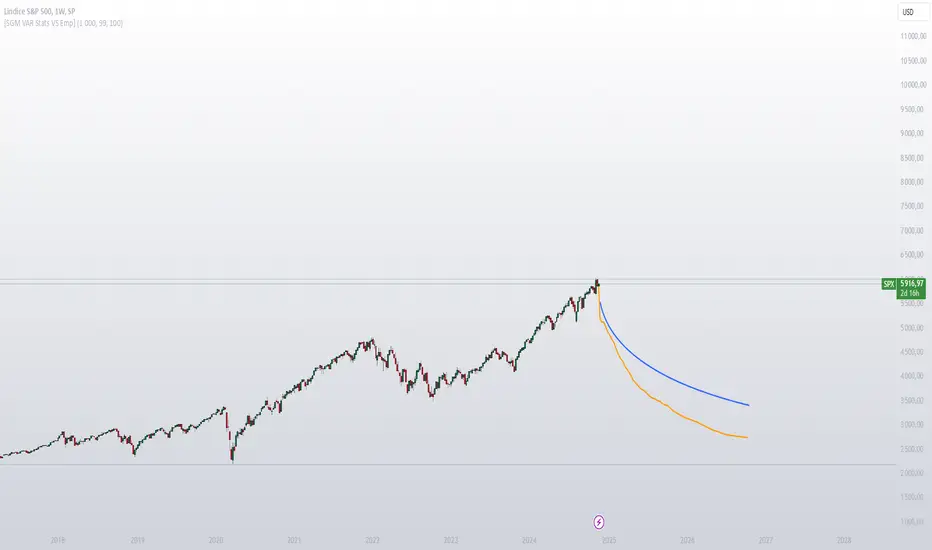
PolyLines (Graphs)
Generates projections visually through polylines:
Statistical Polyline (Blue): Based on traditional statistical methods.
Empirical Polyline (Orange): Derived from empirical data analysis.
Projection Customization
Maximum Data Size: Configurable limit for the historical data array (max_array_size).
Confidence Level: Adjustable by the user (conf_lvl), affects the width of the confidence bands.
Projection Length: Configurable number of projected periods (length_projection).
Key Steps
Capture logarithmic returns and update the historical data array.
Calculate basic statistics (mean, median, standard deviation).
Perform projections:
Empirical: Based on the median of cumulative returns.
Statistical: Based on the mean and standard deviation.
Visualization:
Compare statistical and empirical projections using polylines.
Utility
This script allows users to compare:
Traditional Statistical Projections: Based on mathematical properties of historical returns.
Empirical Projections: Relying on direct historical observations.
Divergence or convergence of these lines also highlights the presence of skewness or kurtosis in the return distribution.

Ideal for traders and financial analysts looking to assess an asset’s potential future performance using combined statistical and empirical approaches.
Logarithmic Returns & Historical Data
Calculates logarithmic returns from closing prices.
Stores these returns in a dynamic array with a configurable maximum size.
Approximation of the Inverse Error Function
Uses an approximation of the erfinv function to calculate z-scores for given confidence levels.
Basic Statistics
Mean: Calculates the average of the data in the array.
Standard Deviation: Measures the dispersion of returns.
Median: Provides a more robust measure of central tendency for skewed distributions.
Z-Score: Converts a confidence level into a standard deviation multiplier.
Empirical vs. Statistical Projection
Empirical Projection
Based on the median of cumulative returns for each projected period.
Applies an adjustable confidence filter to exclude extreme values.
Statistical Projection
Relies on the mean and standard deviation of historical returns.
Incorporates a standard deviation multiplier for confidence-adjusted projections.
PolyLines (Graphs)
Generates projections visually through polylines:
Statistical Polyline (Blue): Based on traditional statistical methods.
Empirical Polyline (Orange): Derived from empirical data analysis.
Projection Customization
Maximum Data Size: Configurable limit for the historical data array (max_array_size).
Confidence Level: Adjustable by the user (conf_lvl), affects the width of the confidence bands.
Projection Length: Configurable number of projected periods (length_projection).
Key Steps
Capture logarithmic returns and update the historical data array.
Calculate basic statistics (mean, median, standard deviation).
Perform projections:
Empirical: Based on the median of cumulative returns.
Statistical: Based on the mean and standard deviation.
Visualization:
Compare statistical and empirical projections using polylines.
Utility
This script allows users to compare:
Traditional Statistical Projections: Based on mathematical properties of historical returns.
Empirical Projections: Relying on direct historical observations.
Divergence or convergence of these lines also highlights the presence of skewness or kurtosis in the return distribution.
Ideal for traders and financial analysts looking to assess an asset’s potential future performance using combined statistical and empirical approaches.
Notas de prensa
changing initial settingsNotas de prensa
-Script de código abierto
Fiel al espíritu de TradingView, el creador de este script lo ha convertido en código abierto, para que los traders puedan revisar y verificar su funcionalidad. ¡Enhorabuena al autor! Aunque puede utilizarlo de forma gratuita, recuerde que la republicación del código está sujeta a nuestras Normas internas.
Sigaud | Junior Quantitative Trader & Developer
Combining technical expertise with analytical precision.
Gaining experience and growing in the field.
📧 Contact: from the website
Combining technical expertise with analytical precision.
Gaining experience and growing in the field.
📧 Contact: from the website
Exención de responsabilidad
La información y las publicaciones no constituyen, ni deben considerarse como asesoramiento o recomendaciones financieras, de inversión, de trading o de otro tipo proporcionadas o respaldadas por TradingView. Más información en Condiciones de uso.
Script de código abierto
Fiel al espíritu de TradingView, el creador de este script lo ha convertido en código abierto, para que los traders puedan revisar y verificar su funcionalidad. ¡Enhorabuena al autor! Aunque puede utilizarlo de forma gratuita, recuerde que la republicación del código está sujeta a nuestras Normas internas.
Sigaud | Junior Quantitative Trader & Developer
Combining technical expertise with analytical precision.
Gaining experience and growing in the field.
📧 Contact: from the website
Combining technical expertise with analytical precision.
Gaining experience and growing in the field.
📧 Contact: from the website
Exención de responsabilidad
La información y las publicaciones no constituyen, ni deben considerarse como asesoramiento o recomendaciones financieras, de inversión, de trading o de otro tipo proporcionadas o respaldadas por TradingView. Más información en Condiciones de uso.