OPEN-SOURCE SCRIPT
Simple Monthly Seasonality
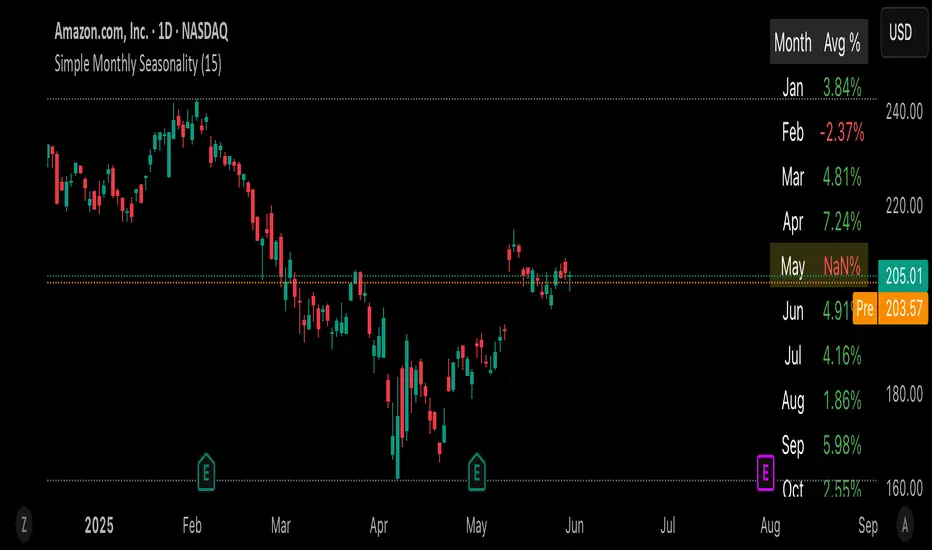
This script helps traders quickly visualize how an asset performs month by month over a customizable historical period.
🔍 What it does:
• Calculates average monthly returns over the past N years (default: 15).
• Highlights the current month for quick context.
• Displays results in a clean 2-column table (Month | Avg % Return).
💡 Features:
• Works on any timeframe – internally pulls monthly data.
• Color-coded performance (green for positive, red for negative).
• Dynamic highlights – the current month is softly emphasized.
• Fully customizable lookback period (1–50 years).
📈 Use cases:
• Spot seasonal market trends.
• Time entries/exits based on recurring historical strength/weakness.
• Build the foundation for more advanced seasonality or macro scripts.
Just load it on any chart and see which months historically outshine the rest.
⸻
Script de código abierto
Fiel al espíritu de TradingView, el creador de este script lo ha convertido en código abierto, para que los traders puedan revisar y verificar su funcionalidad. ¡Enhorabuena al autor! Aunque puede utilizarlo de forma gratuita, recuerde que la republicación del código está sujeta a nuestras Normas internas.
Exención de responsabilidad
La información y las publicaciones no constituyen, ni deben considerarse como asesoramiento o recomendaciones financieras, de inversión, de trading o de otro tipo proporcionadas o respaldadas por TradingView. Más información en Condiciones de uso.