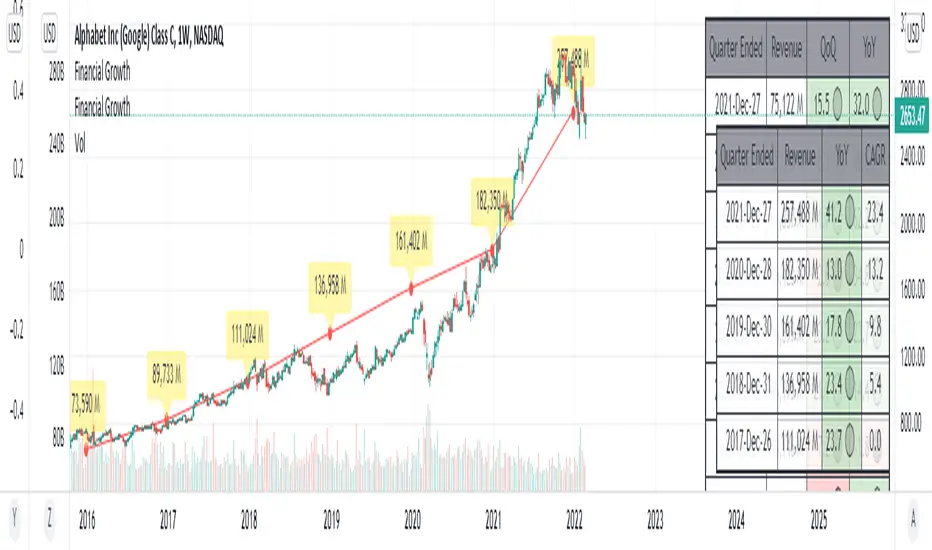
This indicator will acquire the financial data provided by Tradview.
the data is compare between Quarter, Annual and TTM in term of percent of growth.
YoY, QoQ and CAGR is also available by this script (The minimum is 4).
in addition, ploting of data, label and table also available (you can check the mark to toggle on / off).
Data : Revenue, Net Income, EBITDA, EPS, DVPS, Free Cash Flow and Forward PE .
How to use it.
just select the financial data, period and size of data to compare.
you can check the box to toggle the plotting line, label and table.
Enjoy.
Notas de prensa
Fix comparison calculations Notas de prensa
- More items added. - fixed CAGR.
New Items Added
- Key Financial Number : Revenue, Net Income, EBITDA, EPS, DVPS, Free Cash Flow, Total Debt
- Key Financial Ratio : Gross Margin, EBITDA Margin, Net Margin, ROE, ROA, Price to Book Value (P/BV), Price to Earnings (P/E)
Notas de prensa
Update Detail : 2022-Dec-17- Add 2 financial items.
- Add eps, diluted.
- Re-arrange code.
Notas de prensa
Re-arranged code. Add more items related to debt.
Notas de prensa
there's some problem about version.so i updated again.
Script de código abierto
Fiel al espíritu de TradingView, el creador de este script lo ha convertido en código abierto, para que los traders puedan revisar y verificar su funcionalidad. ¡Enhorabuena al autor! Aunque puede utilizarlo de forma gratuita, recuerde que la republicación del código está sujeta a nuestras Normas internas.
Exención de responsabilidad
La información y las publicaciones no constituyen, ni deben considerarse como asesoramiento o recomendaciones financieras, de inversión, de trading o de otro tipo proporcionadas o respaldadas por TradingView. Más información en Condiciones de uso.
