OPEN-SOURCE SCRIPT
Actualizado Wave Anchor Indicator
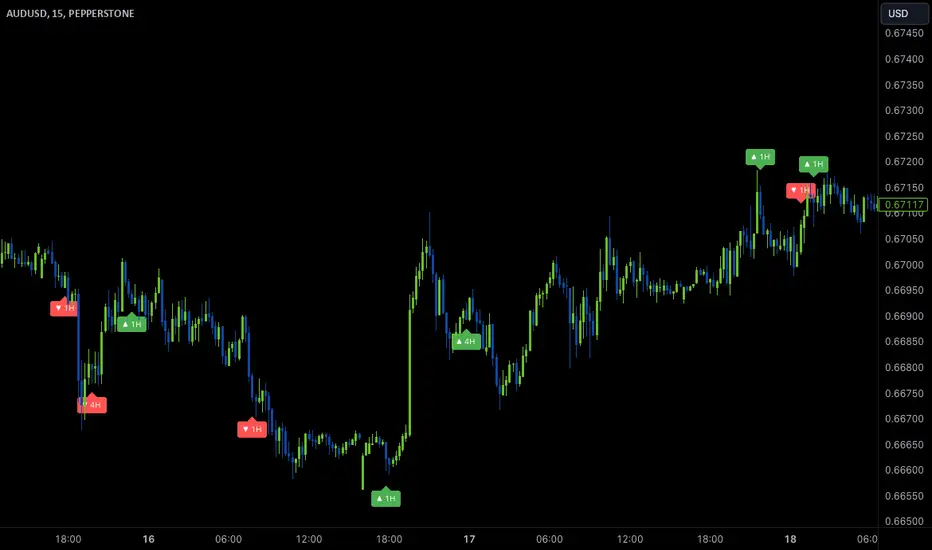
The Wave Anchor Indicator is designed to mark the crossing of overbought and oversold levels of higher time frame momentum waves, based on the VuManChu Cipher B+Divergences Wave Trend Indicator. This tool is inspired by the TP Mint trading strategy, which relies heavily on the momentum waves of Market Cipher B or VuManChu Cipher B for identifying optimal entry and exit points.
Key Concept: Anchored Waves
In the TP Mint strategy, momentum waves in overbought (above 60) or oversold (below -60) conditions on higher time frames are considered "anchored." These anchored waves provide strong signals for entries and take-profit points when viewed on lower time frames. The Wave Anchor Indicator focuses on these anchor conditions to help traders make informed decisions by seeing higher time frame anchor states directly on the entry time frame chart.
How It Works
Labeling Signals:
- On lower time frames, such as the 15-minute chart, the indicator shows labels when higher
time frame momentum waves (1-hour and 4-hour) cross the overbought or oversold levels.
- Labels above price indicate overbought conditions, with green labels when the wave crosses
upward and red labels when crossing downward.
- Labels below price signal oversold conditions, with red for a downward cross and green for an
upward cross.
- Each label displays the time frame of the crossing momentum wave, providing context for
traders at a glance.
Time Frame Pairings:
- On the 15-minute time frame, the indicator tracks anchor conditions from the 1-hour and 4-
hour time frames.
- On the 1-hour chart, it monitors 4-hour and daily time frame anchor conditions.
Customization and Alerts
Flexible Display Options: Users can choose to display none, one, or both of the grouped higher time frame labels, depending on their strategy and preferences.
Alerts: The indicator also allows for custom alerts when a label appears, helping traders stay on top of key market movements without constantly monitoring the chart.
Use Cases
This indicator is ideal for traders who use momentum-based strategies across multiple time frames. It simplifies the process of identifying key entry and exit points by focusing on the anchor conditions from higher time frames, making it easier to execute the TP Mint strategy or similar methods.
Thank you to VuManChu and LazyBear for mamking the momentum wave code open source and allowing it’s use in this indicator.
Notas de prensa
Release NotesVersion 10.23.24 r55
• Changed label shapes and added text arrow to label to clarify direction of wave cross
• Alert text changed for clarity
• Label offset increased to reduce overlap with candles
Script de código abierto
Fiel al espíritu de TradingView, el creador de este script lo ha convertido en código abierto, para que los traders puedan revisar y verificar su funcionalidad. ¡Enhorabuena al autor! Aunque puede utilizarlo de forma gratuita, recuerde que la republicación del código está sujeta a nuestras Normas internas.
Exención de responsabilidad
La información y las publicaciones no constituyen, ni deben considerarse como asesoramiento o recomendaciones financieras, de inversión, de trading o de otro tipo proporcionadas o respaldadas por TradingView. Más información en Condiciones de uso.