OPEN-SOURCE SCRIPT
Actualizado ZOR
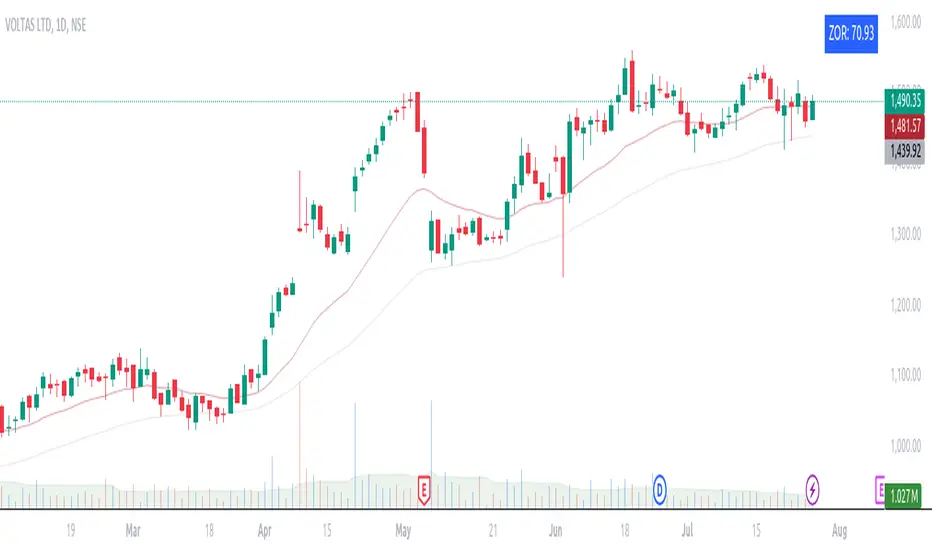
ZOR (Zone of Outperformance Ratio) with Supporting Indicators
This custom indicator introduces an approach to measuring asset performance through the Zone of Outperformance Ratio (ZOR), complemented by two supporting indicators for comprehensive market analysis.
1. ZOR (Zone of Outperformance Ratio)
The ZOR is the cornerstone of this indicator, offering a unique perspective on an asset's performance across multiple time zones:
Key Features:
2. Supporting Indicators
To enhance analysis and provide context to the ZOR score, two additional indicators are included:
a) Distance to 52-week High:
b) Distance to EMA:
Originality and Usefulness
The ZOR indicator offers a fresh perspective on relative performance by:
The supporting indicators complement the ZOR by offering additional context:
This combination allows traders to:
How to Use
1. Add the indicator to your chart
2. Customize settings in the indicator properties:
- Set benchmark symbol
- Toggle visibility of supporting indicators
- Customize EMA length for Distance to EMA
- Adjust ZOR calculation weights(Optional)
3. Interpret the color-coded labels:
- ZOR: Blue (strong performance) or Red (weaker performance)
- Distance to High: Yellow-green (above 52-week high) or Dark green (below)
- Distance to EMA: Purple label showing percentage
4. Use in conjunction with other technical and fundamental analysis for comprehensive trading decisions
This indicator provides a unique, multi-faceted approach to performance analysis, combining relative strength measurement with trend and momentum indicators for a holistic market view.
This custom indicator introduces an approach to measuring asset performance through the Zone of Outperformance Ratio (ZOR), complemented by two supporting indicators for comprehensive market analysis.
1. ZOR (Zone of Outperformance Ratio)
The ZOR is the cornerstone of this indicator, offering a unique perspective on an asset's performance across multiple time zones:
- Measures the degree of an asset's outperformance against a benchmark (default: NSE:NIFTY) across different time zones
- Utilizes a weighted multi-timeframe approach for a holistic performance view
- Combines performance ratios from 63, 126, 189, and 252-day zones and results in a score between 0-99, with higher scores indicating stronger outperformance across zones
Key Features:
- Fully configurable weights for each timeframe (63, 126, 189, 252 days)
- Customizable benchmark symbol
- Color-coded display: Blue for scores ≥60 (strong performance), Red for scores <60 (weaker performance)
2. Supporting Indicators
To enhance analysis and provide context to the ZOR score, two additional indicators are included:
a) Distance to 52-week High:
- Calculates the percentage distance between current price and 52-week high
- Color-coded for quick interpretation:
- Yellow-green when price is above 52-week high
- Dark green when price is below 52-week high
- Helps identify potential overbought conditions or breakout scenarios
b) Distance to EMA:
- Shows percentage distance from current price to a user-defined EMA (default: 21-day)
- Helps gauge short-term momentum relative to the trend
- Useful for identifying potential mean reversion opportunities
Originality and Usefulness
The ZOR indicator offers a fresh perspective on relative performance by:
- Combining multiple timeframes into a single, easy-to-interpret score
- Applying a non-linear transformation to emphasize recent performance
- Providing a flexible framework for comparing assets against any chosen benchmark
The supporting indicators complement the ZOR by offering additional context:
- Distance to 52-week High helps identify potential trend strength and breakout scenarios
- Distance to EMA provides insights into short-term momentum and potential mean reversion
This combination allows traders to:
- Quickly identify outperforming assets across multiple timeframes
- Assess whether an asset is extended from its long-term highs or short-term average
- Make more informed decisions by considering relative performance, trend strength, and momentum in a single view
How to Use
1. Add the indicator to your chart
2. Customize settings in the indicator properties:
- Set benchmark symbol
- Toggle visibility of supporting indicators
- Customize EMA length for Distance to EMA
- Adjust ZOR calculation weights(Optional)
3. Interpret the color-coded labels:
- ZOR: Blue (strong performance) or Red (weaker performance)
- Distance to High: Yellow-green (above 52-week high) or Dark green (below)
- Distance to EMA: Purple label showing percentage
4. Use in conjunction with other technical and fundamental analysis for comprehensive trading decisions
This indicator provides a unique, multi-faceted approach to performance analysis, combining relative strength measurement with trend and momentum indicators for a holistic market view.
Notas de prensa
ZOR (Zone of Outperformance Ratio) with Integrated Market Position IndicatorsThis script combines a custom-designed relative performance metric, the Zone of Outperformance Ratio (ZOR), with two market position indicators to provide traders with a comprehensive view of an asset's performance and current market stance.
1. ZOR (Zone of Outperformance Ratio)
The ZOR offers a nuanced measure of an asset's performance, uniquely combining multiple timeframes:
- Calculates relative performance against a benchmark (default: NSE:NIFTY) across 63, 126, 189, and 252-day periods
- Employs a weighted average, emphasizing recent performance while considering long-term trends
- Applies a square root transformation to balance sensitivity and stability
- Scales results to a 0-99 range for intuitive interpretation
- Features a "Strict Mode" for optimal accuracy (enabled by default)
Strict Mode:
To ensure the highest level of accuracy and reliability, the ZOR indicator includes a Strict Mode feature:
- When enabled, ZOR is displayed only when at least 252 bars of data are available
- This ensures that all timeframes (63, 126, 189, and 252 days) are fully accounted for in the calculation
- Results in more stable and meaningful ZOR scores, especially for long-term analysis
- Can be toggled off for more immediate (but potentially less comprehensive) results on newer assets or timeframes
Calculation Example:
For a 63-day period:
- Asset return: 10%, Benchmark return: 5%
- Result: (1.10 / 1.05) - 1 = 4.76%
- Weighted (e.g., 40% * 4.76% = 1.904%)
This process is repeated for all periods, summed, transformed, and scaled to the final ZOR score, providing a more comprehensive performance view than simple price comparisons.
2. Optional Supporting Indicators
Two additional indicators can be enabled to complement the ZOR, offering crucial market context:
a) Distance to 52-week High:
- Calculates: (Current Price - 52-week High) / 52-week High * 100
- Color-coded: Yellow-green (above high), Dark green (below high)
- Helps identify potential overbought conditions or breakout scenarios
b) Distance to EMA:
- Calculates: (Current Price - EMA) / EMA * 100
- Default EMA period: 21 days (customizable)
- Useful for gauging short-term momentum and mean reversion potential
How These Components Work Together
The integration of these indicators provides unique insights:
1. High ZOR + High Distance to 52-week High: Potential strong trend or overbought condition
2. High ZOR + Low Distance to EMA: Possible pullback in a strong trend, potential entry point
3. Low ZOR + Large negative Distance to 52-week High: Potential value opportunity
This combination allows traders to quickly assess both relative performance and current market positioning, enabling more informed decision-making based on comprehensive data.
How to Use
1. Add the indicator to your chart
2. Customize settings:
- Set benchmark symbol for comparison (default: NSE:NIFTY)
- Toggle Strict Mode based on your analysis needs (recommended to keep enabled for most accurate results)
- Enable optional supporting indicators:
* Check "Show Distance to High" to display the Distance to 52-week High indicator
* Check "Show Distance to EMA" to display the Distance to EMA indicator
- If enabling Distance to EMA, customize the EMA length (default is 21 days)
- Adjust ZOR weights to emphasize different time periods (Optional)
3. Interpret color-coded labels:
- ZOR: Blue (strong) or Red (weak)
- If enabled:
* Distance to High: Yellow-green (above) or Dark green (below)
* Distance to EMA: Purple label
4. Use enabled indicators together to identify potential trades:
- High ZOR scores for outperforming assets
- If enabled, use Distance to High for historical context and Distance to EMA for short-term conditions
5. Combine with other technical and fundamental analysis
This flexible script, centered on the unique ZOR indicator and enhanced by optional supporting indicators, provides a customizable and highly reliable view of asset performance and market position, enabling more contextual and informed trading decisions.
Notas de prensa
- ZOR score is now rounded
- Changes to strict mode ZOR calculation: If the number of bars is less than 252, the ZOR score will be set to 0 to avoid inaccuracies.
- Experimental: The script now plots the ZOR score to evaluate its potential use in the screener. (Work in Progress)
Notas de prensa
Release notes:- Distance to 52w High indicator simplified: If stock already made new High, it now shows label At or Above 52W High
- Distance to 52w High and EMA indicator calculation corrected as suggested by user Triyambak_CA
Script de código abierto
Fiel al espíritu de TradingView, el creador de este script lo ha convertido en código abierto, para que los traders puedan revisar y verificar su funcionalidad. ¡Enhorabuena al autor! Aunque puede utilizarlo de forma gratuita, recuerde que la republicación del código está sujeta a nuestras Normas internas.
Exención de responsabilidad
La información y las publicaciones no constituyen, ni deben considerarse como asesoramiento o recomendaciones financieras, de inversión, de trading o de otro tipo proporcionadas o respaldadas por TradingView. Más información en Condiciones de uso.