OPEN-SOURCE SCRIPT
Actualizado SL and TP - ATR
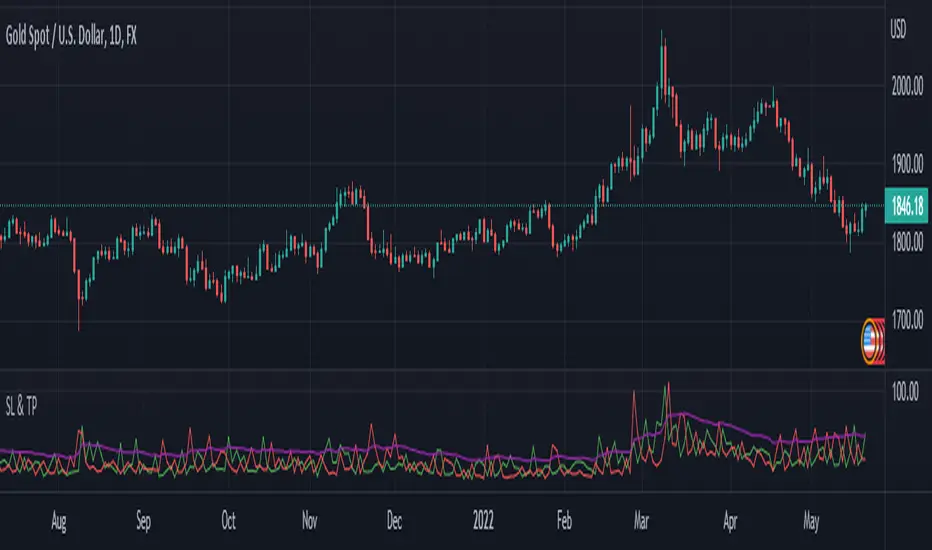
This indicator is using ATR ( Average True Range ) to set the Target point and Stop loss.
Use the pink number as target, always.
If you are in Long position, use the green number as stop loss, so the red number is not useful in Buys.
If you are in Short position, use the Red number as stop loss, so the green number is not useful in Sells.
** Need to enter the numbers in ticks --> VERY IMPORTANT: Write it completely, even the numbers after the point sign but DO NOT WRITE the point sign itself. e.g. : if the target tick on indicator is 123.75, you have to write 12375 ticks for your TP. ( one more example: If the number is 0.0001203 , write 1203 ticks. )
Enter the information of the opening candle.
Most of the times, risk/reward ratio is a bit higher than 1.
Works on multi timeframes. P.S: Haven't checked the weekly timeframe.
Not trying to oversell the indicator, but this is perhaps the best TP/SL specifier.
For beauty purposes, change (Sl @ buy) and (TP @ sell) to histograms.
Histograms are only for visual purposes. Customize the indicator as you want :)) Hope you enjoy
Notas de prensa
Ver. 2 Updates:1. Code has been changed into Version 5 pine script.
2. Default style of " TP PIP " has been changed into histograms.
Script de código abierto
Fiel al espíritu de TradingView, el creador de este script lo ha convertido en código abierto, para que los traders puedan revisar y verificar su funcionalidad. ¡Enhorabuena al autor! Aunque puede utilizarlo de forma gratuita, recuerde que la republicación del código está sujeta a nuestras Normas internas.
Exención de responsabilidad
La información y las publicaciones no constituyen, ni deben considerarse como asesoramiento o recomendaciones financieras, de inversión, de trading o de otro tipo proporcionadas o respaldadas por TradingView. Más información en Condiciones de uso.