OPEN-SOURCE SCRIPT
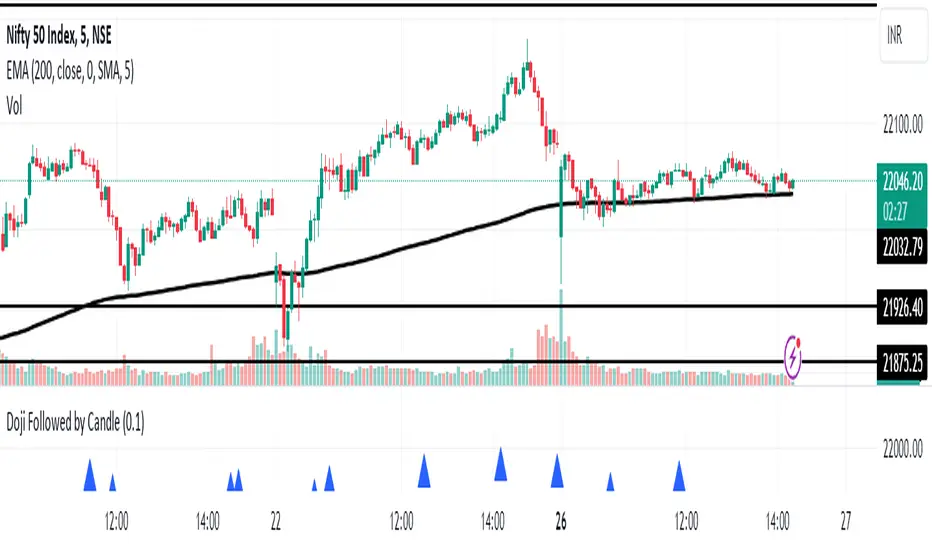
Doji Followed by Bullish or Bearish Candle

This indicator identifies instances where a doji candlestick pattern is followed by either a bullish or bearish candle, indicating potential reversal or continuation signals in the market.
Features:
Doji Detection: Utilizes the concept of doji candlesticks, where the difference between the open and close prices is minimal compared to the candle's overall range.
Candlestick Identification: Determines whether the following candle is bullish (close > open) or bearish (close < open).
Customizable Threshold: Allows users to adjust the sensitivity of the doji detection by modifying the doji body factor parameter.
Alerts: Generates alerts when a doji candle is followed by a bullish or bearish candle, signaling potential trading opportunities.
How to Use:
When a blue triangle appears below a candle, it indicates that a doji candle was followed by a bullish or bearish candle.
Traders can interpret these signals as potential entry or exit points in their trading strategies.
Note: This indicator should be used in conjunction with other technical analysis tools and indicators for comprehensive market analysis.
Script de código abierto
Fiel al espíritu de TradingView, el creador de este script lo ha convertido en código abierto, para que los traders puedan revisar y verificar su funcionalidad. ¡Enhorabuena al autor! Aunque puede utilizarlo de forma gratuita, recuerde que la republicación del código está sujeta a nuestras Normas internas.
Exención de responsabilidad
La información y las publicaciones no constituyen, ni deben considerarse como asesoramiento o recomendaciones financieras, de inversión, de trading o de otro tipo proporcionadas o respaldadas por TradingView. Más información en Condiciones de uso.