OPEN-SOURCE SCRIPT
Volume Crossover Strategy
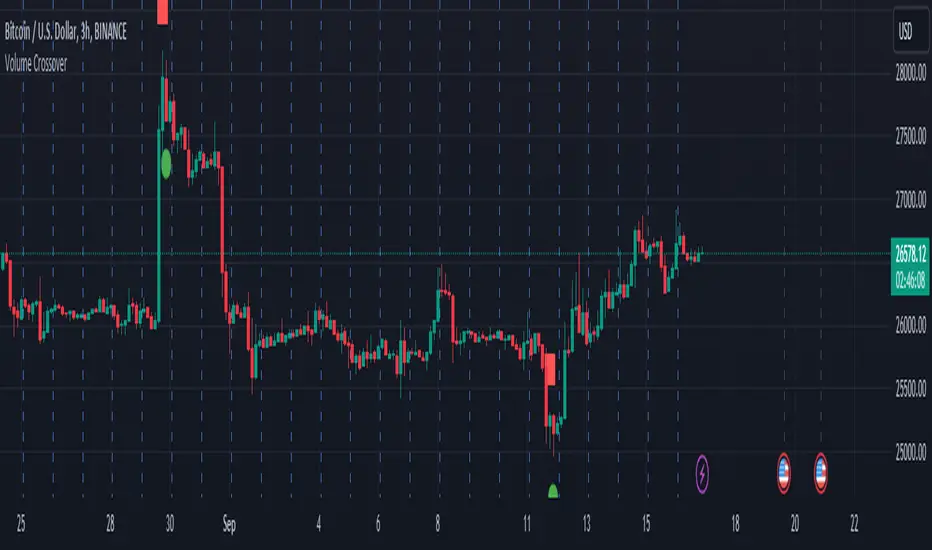
This script shows us the strength and acceleration of the trend, not the direction. ! . The indicator is built on the collision of two volumes (the collision of one-hour and four-hour volumes), where as a result one upward arrow shows us (acceleration, pressing the gas on the pedal), and the downward one shows deceleration (i.e. braking).
Recommendation: Be sure to attach:
a) any trend direction indicator (SMA, EMA), through which we will have an idea where the market is going and going:
b) volatility indicator
c) AD accumulation distribution (let's have a real picture, is there a buying or selling trend)
It is suitable for a one-hour timeframe
P.S. The script does not make any guarantee of profit, it is published only for the purpose of sharing my opinion about this strategy.
an hour ago
Comment:
The green signal is the start of the marathon, and the red signal is the end. For example, if the downward trend has ended (we can see it through the blue signal), it does not mean that the next marathon will necessarily be a reflected trend. It is not excluded that the next marathon will also develop on a downward trend...and therefore in the opposite case as well..
Script de código abierto
Fiel al espíritu de TradingView, el creador de este script lo ha convertido en código abierto, para que los traders puedan revisar y verificar su funcionalidad. ¡Enhorabuena al autor! Aunque puede utilizarlo de forma gratuita, recuerde que la republicación del código está sujeta a nuestras Normas internas.
Exención de responsabilidad
La información y las publicaciones no constituyen, ni deben considerarse como asesoramiento o recomendaciones financieras, de inversión, de trading o de otro tipo proporcionadas o respaldadas por TradingView. Más información en Condiciones de uso.