OPEN-SOURCE SCRIPT
Stick Sandwich Pattern
# Stick Sandwich Pattern Indicator
## Description
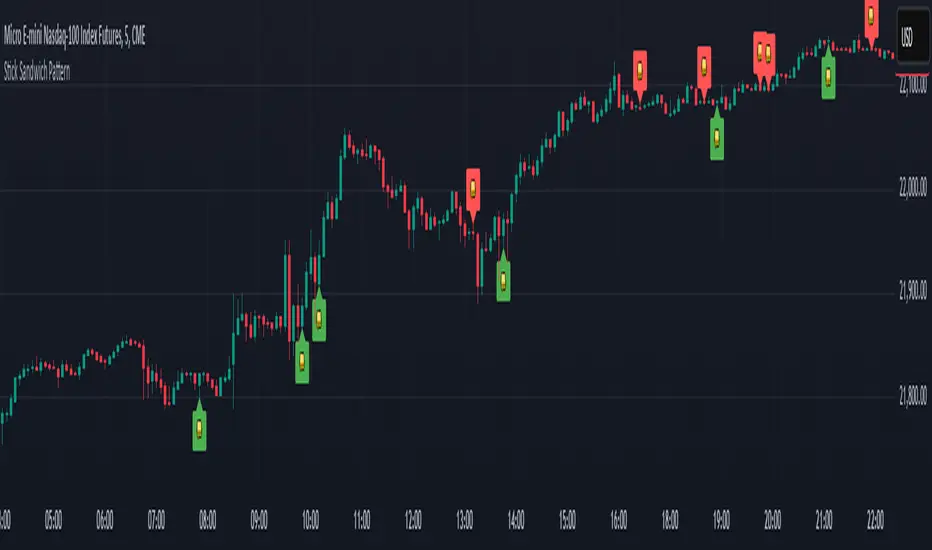
The Stick Sandwich Pattern Indicator is a custom TradingView script that identifies specific three-candle patterns in financial markets. The indicator uses a sandwich emoji (🥪) to mark pattern occurrences directly on the chart, making it visually intuitive and easy to spot potential trading opportunities.
## Pattern Types
### Bullish Stick Sandwich
A bullish stick sandwich pattern is identified when:
- First candle: Bullish (close > open)
- Second candle: Bearish (close < open)
- Third candle: Bullish (close > open)
- The closing price of the third candle is within 10% of the first candle's range from its closing price
### Bearish Stick Sandwich
A bearish stick sandwich pattern is identified when:
- First candle: Bearish (close < open)
- Second candle: Bullish (close > open)
- Third candle: Bearish (close < open)
- The closing price of the third candle is within 10% of the first candle's range from its closing price
## Technical Implementation
- Written in Pine Script v5
- Runs as an overlay indicator
- Uses a 10% tolerance range for closing price comparison
- Implements rolling pattern detection over the last 3 candles
- Break statement ensures only the most recent pattern is marked
## Visual Features
- Bullish patterns: Green sandwich emoji above the pattern
- Bearish patterns: Red sandwich emoji below the pattern
- Label size: Small
- Label styles:
- Bullish: Label points upward
- Bearish: Label points downward
## Usage
1. Add the indicator to your TradingView chart
2. Look for sandwich emojis that appear above or below price bars
3. Green emojis indicate potential bullish reversals
4. Red emojis indicate potential bearish reversals
## Code Structure
- Main indicator function with overlay setting
- Two separate functions for pattern detection:
- `bullishStickSandwich()`
- `bearishStickSandwich()`
- Pattern scanning loop that checks the last 3 candles
- Built-in label plotting for visual identification
## Formula Details
The closing price comparison uses the following tolerance calculation:
```
Tolerance = (High - Low of first candle) * 0.1
Valid if: |Close of third candle - Close of first candle| <= Tolerance
```
## Notes
- The indicator marks patterns in real-time as they form
- Only the most recent pattern within the last 3 candles is marked
- Pattern validation includes both candle direction and closing price proximity
- The 10% tolerance helps filter out weak patterns while catching meaningful ones
## Disclaimer
This indicator is for informational purposes only. Always use proper risk management and consider multiple factors when making trading decisions.
## Description
The Stick Sandwich Pattern Indicator is a custom TradingView script that identifies specific three-candle patterns in financial markets. The indicator uses a sandwich emoji (🥪) to mark pattern occurrences directly on the chart, making it visually intuitive and easy to spot potential trading opportunities.
## Pattern Types
### Bullish Stick Sandwich
A bullish stick sandwich pattern is identified when:
- First candle: Bullish (close > open)
- Second candle: Bearish (close < open)
- Third candle: Bullish (close > open)
- The closing price of the third candle is within 10% of the first candle's range from its closing price
### Bearish Stick Sandwich
A bearish stick sandwich pattern is identified when:
- First candle: Bearish (close < open)
- Second candle: Bullish (close > open)
- Third candle: Bearish (close < open)
- The closing price of the third candle is within 10% of the first candle's range from its closing price
## Technical Implementation
- Written in Pine Script v5
- Runs as an overlay indicator
- Uses a 10% tolerance range for closing price comparison
- Implements rolling pattern detection over the last 3 candles
- Break statement ensures only the most recent pattern is marked
## Visual Features
- Bullish patterns: Green sandwich emoji above the pattern
- Bearish patterns: Red sandwich emoji below the pattern
- Label size: Small
- Label styles:
- Bullish: Label points upward
- Bearish: Label points downward
## Usage
1. Add the indicator to your TradingView chart
2. Look for sandwich emojis that appear above or below price bars
3. Green emojis indicate potential bullish reversals
4. Red emojis indicate potential bearish reversals
## Code Structure
- Main indicator function with overlay setting
- Two separate functions for pattern detection:
- `bullishStickSandwich()`
- `bearishStickSandwich()`
- Pattern scanning loop that checks the last 3 candles
- Built-in label plotting for visual identification
## Formula Details
The closing price comparison uses the following tolerance calculation:
```
Tolerance = (High - Low of first candle) * 0.1
Valid if: |Close of third candle - Close of first candle| <= Tolerance
```
## Notes
- The indicator marks patterns in real-time as they form
- Only the most recent pattern within the last 3 candles is marked
- Pattern validation includes both candle direction and closing price proximity
- The 10% tolerance helps filter out weak patterns while catching meaningful ones
## Disclaimer
This indicator is for informational purposes only. Always use proper risk management and consider multiple factors when making trading decisions.
Script de código abierto
Fiel al espíritu de TradingView, el creador de este script lo ha convertido en código abierto, para que los traders puedan revisar y verificar su funcionalidad. ¡Enhorabuena al autor! Aunque puede utilizarlo de forma gratuita, recuerde que la republicación del código está sujeta a nuestras Normas internas.
Exención de responsabilidad
La información y las publicaciones no constituyen, ni deben considerarse como asesoramiento o recomendaciones financieras, de inversión, de trading o de otro tipo proporcionadas o respaldadas por TradingView. Más información en Condiciones de uso.