OPEN-SOURCE SCRIPT
Bollingers Bands Fibonacci ratios_copy of FOMO
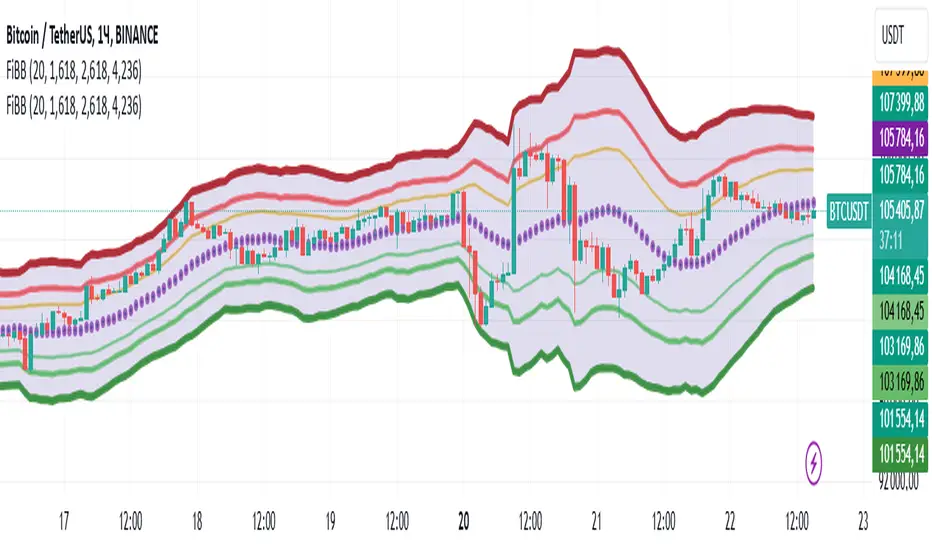
Bollinger Bands Fibonacci Ratios (FiBB)
This TradingView script is a powerful tool that combines the classic Bollinger Bands with Fibonacci ratios to help traders identify potential support and resistance zones based on market volatility.
Key Features:
Dynamic Fibonacci Levels: The script calculates additional levels around a Simple Moving Average (SMA) using Fibonacci ratios (default: 1.618, 2.618, and 4.236). These levels adapt to market volatility using the Average True Range (ATR).
Customizable Parameters: Users can modify the length of the SMA and the Fibonacci ratios to fit their trading strategy and time frame.
Visual Representation: The indicator plots three upper and three lower bands, with color-coded transparency for easy interpretation.
Central SMA Line: The core SMA line provides a baseline for price movement and trend direction.
Shaded Range: The script visually fills the area between the outermost bands to highlight the overall range of price action.
How to Use:
Use the upper bands as potential resistance zones and the lower bands as potential support zones.
Look for price interactions with these levels to identify opportunities for breakout, trend continuation, or reversal trades.
Combine with other indicators or price action analysis to enhance decision-making.
This script is ideal for traders who want a unique blend of Fibonacci-based analysis and Bollinger Bands to better navigate market movements.
Script de código abierto
Fiel al espíritu de TradingView, el creador de este script lo ha convertido en código abierto, para que los traders puedan revisar y verificar su funcionalidad. ¡Enhorabuena al autor! Aunque puede utilizarlo de forma gratuita, recuerde que la republicación del código está sujeta a nuestras Normas internas.
Exención de responsabilidad
La información y las publicaciones no constituyen, ni deben considerarse como asesoramiento o recomendaciones financieras, de inversión, de trading o de otro tipo proporcionadas o respaldadas por TradingView. Más información en Condiciones de uso.