OPEN-SOURCE SCRIPT
BW MFI fixed v6
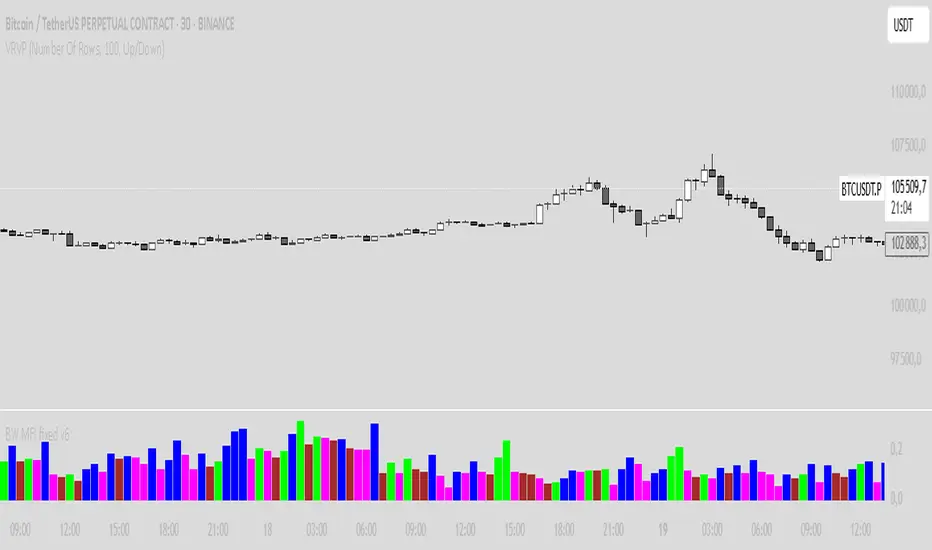
Bill Williams MFI
Sure! Here’s an English description of the indicator you have:
---
### Bill Williams Market Facilitation Index (MFI) — Indicator Description
This indicator implements the **Market Facilitation Index (MFI)** as introduced by Bill Williams. The MFI measures the market's willingness to move the price by comparing the price range to the volume.
---
### How it works:
* **MFI Calculation:**
The MFI is calculated as the difference between the current bar’s high and low prices divided by the volume of that bar:
$$
\text{MFI} = \frac{\text{High} - \text{Low}}{\text{Volume}}
$$
* **Color Coding Logic:**
The indicator compares the current MFI and volume values to their previous values and assigns colors to visualize market conditions according to Bill Williams’ methodology:
| Color | Condition | Market Interpretation |
| ----------- | ------------------ | --------------------------------------------------------------------------------------------- |
| **Green** | MFI ↑ and Volume ↑ | Strong trend continuation or acceleration (increased price movement supported by volume) |
| **Brown** | MFI ↓ and Volume ↓ | Trend weakening or possible pause (both price movement and volume are decreasing) |
| **Blue** | MFI ↑ and Volume ↓ | Possible false breakout or lack of conviction (price moves but volume decreases) |
| **Fuchsia** | MFI ↓ and Volume ↑ | Market indecision or battle between bulls and bears (volume rises but price movement shrinks) |
| **Gray** | None of the above | Neutral or unchanged market condition |
* **Display:**
The indicator plots the MFI values as colored columns on a separate pane below the price chart, providing a visual cue of the market’s behavior.
---
### Purpose:
This tool helps traders identify changes in market momentum and the strength behind price moves, providing insight into when trends might accelerate, weaken, or potentially reverse.
---
If you want, I can help you write a more detailed user guide or trading strategy based on this indicator!
Script de código abierto
Fiel al espíritu de TradingView, el creador de este script lo ha convertido en código abierto, para que los traders puedan revisar y verificar su funcionalidad. ¡Enhorabuena al autor! Aunque puede utilizarlo de forma gratuita, recuerde que la republicación del código está sujeta a nuestras Normas internas.
Exención de responsabilidad
La información y las publicaciones no constituyen, ni deben considerarse como asesoramiento o recomendaciones financieras, de inversión, de trading o de otro tipo proporcionadas o respaldadas por TradingView. Más información en Condiciones de uso.