OPEN-SOURCE SCRIPT
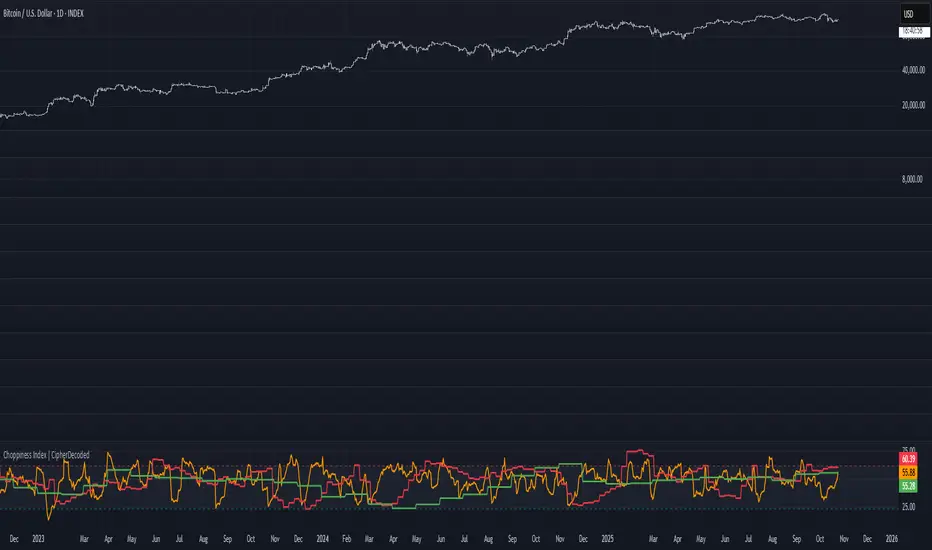
Choppiness Index | CipherDecoded

The Choppiness Index is a multi-timeframe regime indicator that measures whether price action is trending or consolidating.
This recreation was inspired by the Choppiness Index chart from Checkonchain, with full credit to their team for the idea.
🔹How It Works
Pine Script®
Where:
Below is a simplified function used in the script for computing CI on any timeframe:
Pine Script®
🔹Example Background Logic
Pine Script®
🔹Usage Tips
🔹 Disclaimer
This indicator is provided for educational purposes.
No trading outcomes are guaranteed.
This tool does not guarantee market turns or performance; it should be used as part of a broader system.
Use responsibly and perform your own testing.
🔹 Credits
Concept origin — Checkonchain Choppiness Index
This recreation was inspired by the Choppiness Index chart from Checkonchain, with full credit to their team for the idea.
🔹How It Works
CI = 100 * log10( SUM(ATR(1), n) / (highest(high, n) – lowest(low, n)) ) / log10(n)
Where:
- n – lookback length (e.g. 14 days / 10 weeks / 10 months)
- ATR(1) – true-range of each bar
- SUM(ATR(1), n) – total true-range over n bars
- highest(high, n) and lowest(low, n) – price range over n bars
- Low values → strong trend
- High values → sideways consolidation
Below is a simplified function used in the script for computing CI on any timeframe:
f_ci(_n) =>
_tr = ta.tr(true)
_sum = math.sum(_tr, _n)
_hh = ta.highest(high, _n)
_ll = ta.lowest(low, _n)
_rng = _hh - _ll
_rng > 0 ? 100 * math.log10(_sum / _rng) / math.log10(_n) : na
- Consolidation Threshold — 50.0
- Trend Threshold — 38.2
- When Weekly CI < Trend Threshold, a trending zone (yellow) appears.
- When Weekly CI > Consolidation Threshold, a consolidation zone (purple) appears.
- Users can toggle either background independently.
🔹Example Background Logic
bgcolor(isTrend and Trend ? color.new(#f3e459, 50) : na, title = "Trending", force_overlay = true)
bgcolor(isConsol and Cons ? color.new(#974aa5, 50) : na, title = "Consolidation", force_overlay = true)
🔹Usage Tips
- Observe the Weekly CI for regime context.
- Combine with price structure or trend filters for signal confirmation.
- Low CI values (< 38) indicate strong trend activity — the market may soon consolidate to reset.
- High CI values (> 60) reflect sideways or range-bound conditions — the market is recharging before a potential new trend.
🔹 Disclaimer
This indicator is provided for educational purposes.
No trading outcomes are guaranteed.
This tool does not guarantee market turns or performance; it should be used as part of a broader system.
Use responsibly and perform your own testing.
🔹 Credits
Concept origin — Checkonchain Choppiness Index
Script de código abierto
Fiel al espíritu de TradingView, el creador de este script lo ha convertido en código abierto, para que los traders puedan revisar y verificar su funcionalidad. ¡Enhorabuena al autor! Aunque puede utilizarlo de forma gratuita, recuerde que la republicación del código está sujeta a nuestras Normas internas.
Exención de responsabilidad
La información y las publicaciones no constituyen, ni deben considerarse como asesoramiento o recomendaciones financieras, de inversión, de trading o de otro tipo proporcionadas o respaldadas por TradingView. Más información en Condiciones de uso.