OPEN-SOURCE SCRIPT
ETH Top, Mid and Bottom Cap Bands [jcray]
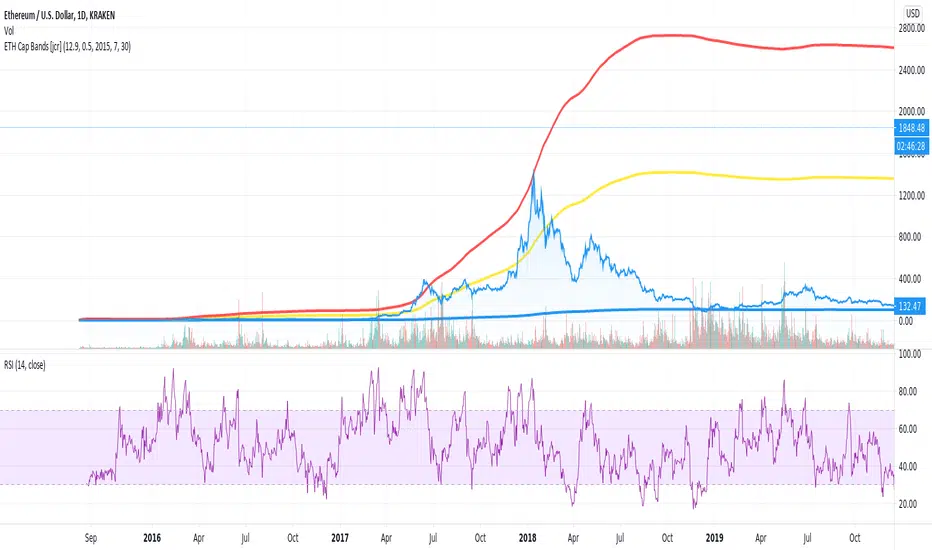
Modified from Average Cap [aamonkey] and Top Cap [aamonkey].
The top cap (red line) can be seen as an absolute market top that may never be significantly exceeded and so is a good indicator to sell a position, or enter a long-term short-sell.
The mid cap (yellow line) can be used as an indicator for market sentiment. Above the mid cap, the market is in a bullish environment, and below it, the market is in a bearish environment.
The bottom cap (blue line) can be seen as an absolute market bottom that may never be fallen short of, and so is a good indicator to enter a long-term buying opportunity, or exit a long-term short-sell.
Script de código abierto
Fiel al espíritu de TradingView, el creador de este script lo ha convertido en código abierto, para que los traders puedan revisar y verificar su funcionalidad. ¡Enhorabuena al autor! Aunque puede utilizarlo de forma gratuita, recuerde que la republicación del código está sujeta a nuestras Normas internas.
Exención de responsabilidad
La información y las publicaciones no constituyen, ni deben considerarse como asesoramiento o recomendaciones financieras, de inversión, de trading o de otro tipo proporcionadas o respaldadas por TradingView. Más información en Condiciones de uso.