PROTECTED SOURCE SCRIPT
Relative Strength Peers -> PROFABIGHI_CAPITAL
🌟 Overview
This indicator evaluates relative strength among a customizable group of assets by comparing their smoothed RSI values, identifying outperformers and underperformers through a scoring matrix. It generates visual tables to rank assets based on peer performance, aiding traders in spotting momentum leaders for potential allocation or rotation strategies.
⚙️ Settings
- Adjustable number of assets for analysis, balancing depth with performance
- RSI calculation period for momentum sensitivity
- Primary moving average type and length for initial RSI smoothing
- Optional secondary moving average type and length for advanced comparison
- Toggle for dual moving average scoring versus threshold-based evaluation
- Volatility lookback for adaptive smoothing in variable market conditions
- Table customization options like text size, header visibility, and input summaries
- Highlighting preferences for trends, top performers, and visual emphasis methods
- Enable/disable switches for RSI computations, table displays, and asset inputs
📊 Data Acquisition & Preparation
- Fetches real-time closing prices from selected asset tickers using security requests
- Cleans ticker symbols by removing exchange prefixes for consistent labeling
- Limits analysis to specified asset count to optimize processing speed
- Stores prices in dedicated variables per asset for efficient relative calculations
- Validates data integrity by detecting constant or invalid sources
- Builds an array of user-defined assets, supporting up to 40 cryptocurrency pairs
- Updates prices only on confirmed bars to ensure reliable historical alignment
📈 RSI Smoothing & Scoring Logic
- Computes base RSI on asset prices normalized against each peer for relative momentum
- Applies user-selected smoothing to RSI using various moving average methods
- Supports simple averages like SMA and EMA for basic trend filtering
- Includes advanced options such as HMA for reduced lag and VIDYA for volatility adaptation
- Handles double smoothing with optional second MA for crossover-based signals
- Assigns binary scores: outperforming (1) if smoothed RSI exceeds neutral threshold or faster MA leads slower one
- Aggregates scores across all peers into per-asset totals for overall strength ranking
- Ranks assets by descending sum, with ties preserved in top performer lists
📋 Matrix & Ranking Computation
- Constructs a comprehensive score matrix comparing each asset against every other
- Populates rows and columns with directional indicators for quick outperformance scans
- Sums row values to quantify an asset's dominance over the peer group
- Derives ranks through pairwise comparisons, prioritizing higher total scores
- Manages ties in rankings to ensure fair representation in leaderboards
- Combines matrix data into a flattened array for efficient table rendering
- Filters computations to active asset count, avoiding unnecessary overhead
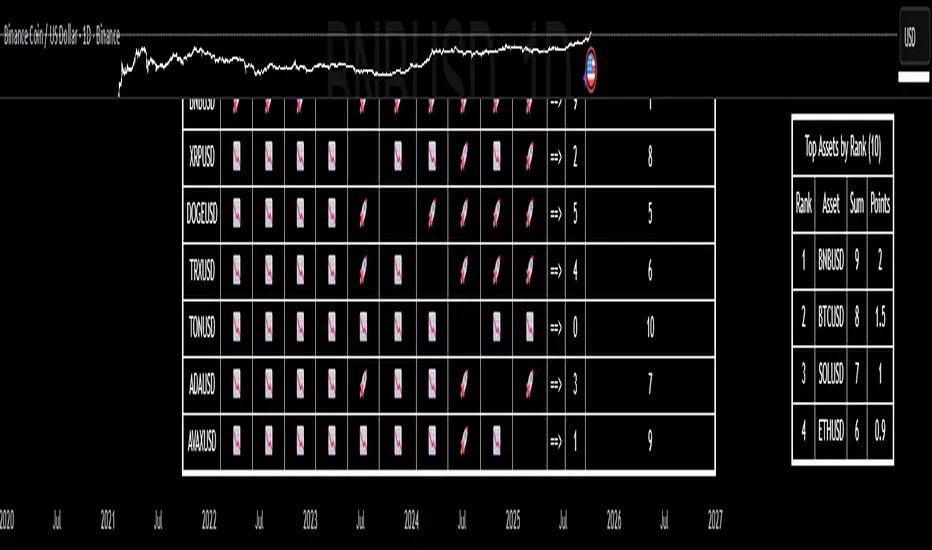
📉 Visualization
- Renders a main table as a heatmap-style matrix with rocket (🚀) for outperformance and down arrow (📉) for underperformance
- Displays asset labels along axes, with diagonal blanks to avoid self-comparisons
- Includes summary columns for total scores and final ranks, with optional gradient highlighting
- Positions a compact top assets table in the upper right, listing leaders with points allocation
- Customizes appearance via text sizing, background/text emphasis, and header toggles
- Shows input parameters summary row for quick reference without menu access
- Updates visuals only on the last bar for real-time relevance without repainting
🛠 Performance & Customization
- Conditional enabling of features like RSI analysis to reduce computational load
- Modular functions for price fetching, smoothing, and scoring to enhance maintainability
- Array-based storage for scalable handling of up to 40 assets without code bloat
- Inline options for MA configurations to streamline user interface
- Tooltip guidance on each input for contextual help during setup
- Fixed table positions (bottom center for main, top right for leaders) for consistent viewing
- Handles edge cases like zero volatility or missing data with fallback logic
✅ Key Takeaways
- Delivers peer-relative momentum insights through RSI-driven scoring and visual matrices
- Flexible smoothing and dual-MA modes adapt to diverse trading styles and sensitivities
- Prioritizes top performers with ranked tables, easing asset rotation decisions
- Optimizes for performance with toggles and limits, suitable for live trading dashboards
- Combines quantitative ranks with intuitive symbols for rapid market scanning
This indicator evaluates relative strength among a customizable group of assets by comparing their smoothed RSI values, identifying outperformers and underperformers through a scoring matrix. It generates visual tables to rank assets based on peer performance, aiding traders in spotting momentum leaders for potential allocation or rotation strategies.
⚙️ Settings
- Adjustable number of assets for analysis, balancing depth with performance
- RSI calculation period for momentum sensitivity
- Primary moving average type and length for initial RSI smoothing
- Optional secondary moving average type and length for advanced comparison
- Toggle for dual moving average scoring versus threshold-based evaluation
- Volatility lookback for adaptive smoothing in variable market conditions
- Table customization options like text size, header visibility, and input summaries
- Highlighting preferences for trends, top performers, and visual emphasis methods
- Enable/disable switches for RSI computations, table displays, and asset inputs
📊 Data Acquisition & Preparation
- Fetches real-time closing prices from selected asset tickers using security requests
- Cleans ticker symbols by removing exchange prefixes for consistent labeling
- Limits analysis to specified asset count to optimize processing speed
- Stores prices in dedicated variables per asset for efficient relative calculations
- Validates data integrity by detecting constant or invalid sources
- Builds an array of user-defined assets, supporting up to 40 cryptocurrency pairs
- Updates prices only on confirmed bars to ensure reliable historical alignment
📈 RSI Smoothing & Scoring Logic
- Computes base RSI on asset prices normalized against each peer for relative momentum
- Applies user-selected smoothing to RSI using various moving average methods
- Supports simple averages like SMA and EMA for basic trend filtering
- Includes advanced options such as HMA for reduced lag and VIDYA for volatility adaptation
- Handles double smoothing with optional second MA for crossover-based signals
- Assigns binary scores: outperforming (1) if smoothed RSI exceeds neutral threshold or faster MA leads slower one
- Aggregates scores across all peers into per-asset totals for overall strength ranking
- Ranks assets by descending sum, with ties preserved in top performer lists
📋 Matrix & Ranking Computation
- Constructs a comprehensive score matrix comparing each asset against every other
- Populates rows and columns with directional indicators for quick outperformance scans
- Sums row values to quantify an asset's dominance over the peer group
- Derives ranks through pairwise comparisons, prioritizing higher total scores
- Manages ties in rankings to ensure fair representation in leaderboards
- Combines matrix data into a flattened array for efficient table rendering
- Filters computations to active asset count, avoiding unnecessary overhead
📉 Visualization
- Renders a main table as a heatmap-style matrix with rocket (🚀) for outperformance and down arrow (📉) for underperformance
- Displays asset labels along axes, with diagonal blanks to avoid self-comparisons
- Includes summary columns for total scores and final ranks, with optional gradient highlighting
- Positions a compact top assets table in the upper right, listing leaders with points allocation
- Customizes appearance via text sizing, background/text emphasis, and header toggles
- Shows input parameters summary row for quick reference without menu access
- Updates visuals only on the last bar for real-time relevance without repainting
🛠 Performance & Customization
- Conditional enabling of features like RSI analysis to reduce computational load
- Modular functions for price fetching, smoothing, and scoring to enhance maintainability
- Array-based storage for scalable handling of up to 40 assets without code bloat
- Inline options for MA configurations to streamline user interface
- Tooltip guidance on each input for contextual help during setup
- Fixed table positions (bottom center for main, top right for leaders) for consistent viewing
- Handles edge cases like zero volatility or missing data with fallback logic
✅ Key Takeaways
- Delivers peer-relative momentum insights through RSI-driven scoring and visual matrices
- Flexible smoothing and dual-MA modes adapt to diverse trading styles and sensitivities
- Prioritizes top performers with ranked tables, easing asset rotation decisions
- Optimizes for performance with toggles and limits, suitable for live trading dashboards
- Combines quantitative ranks with intuitive symbols for rapid market scanning
Script protegido
Este script se publica como código cerrado. Sin embargo, puede utilizarlo libremente y sin limitaciones: obtenga más información aquí.
Exención de responsabilidad
La información y las publicaciones que ofrecemos, no implican ni constituyen un asesoramiento financiero, ni de inversión, trading o cualquier otro tipo de consejo o recomendación emitida o respaldada por TradingView. Puede obtener información adicional en las Condiciones de uso.