Rúnar V2 - Trend Strength, Confirmation and Exhaustion
So after a lot of feedback on the initial Runar script, I have finally completed V2 as per your feedback. The original script had some issues with repainting as this is a multi-time frame script and the periods we included on the original were far too large. This actually addresses the other issue of the script originally being quite slow or very specific around which dots/signals it would print. The new script is therefor a lot more reactive and responsive to market behavior especially crypto.
I have re-introduced the Certainty score as a result for you to modify and play with. Right now its set to its highest variable, but you can choose lower. I recommend no lower than 2 as dots prints will become meaningless to me but may be helpful to others.
How to use the indicator:
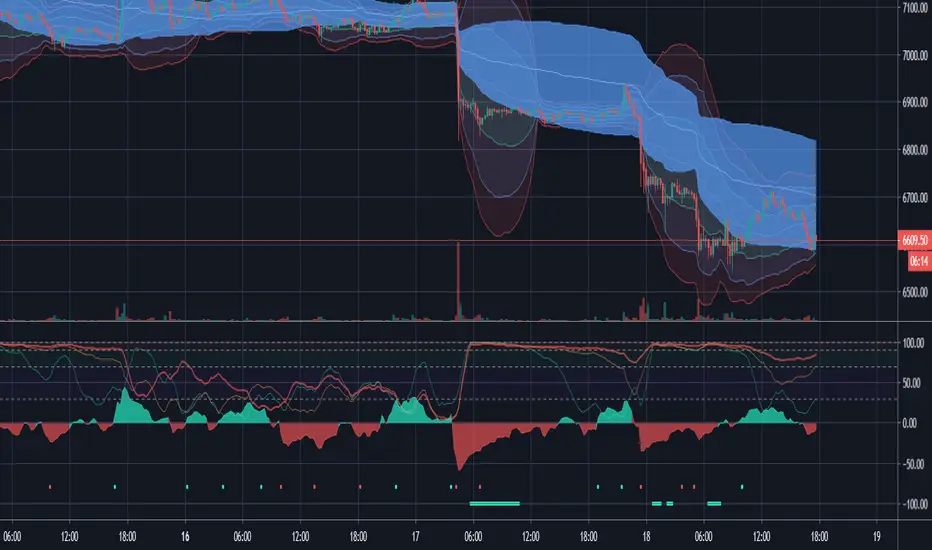
Something I get asked a lot, so lets break it down in full. The indicator comes with two primary areas and two secondary. The first two primary is the actual waves we see in the center oscillating around 0. These waves measure market direction and strength and will print a dot (its secondary) to signify a larger move. This makes some qualities of Runar predictive, but remember sudden moves will not be picked up on higher time frames.
The color of the wave will signify the color of the dot. We will not currently get a green dot printing during a red wave. This is intentional to avoid flip flopping too much during market movement and allows us to confidently follow trend instead.
The second part of the indicator consists of the top 3 lines osculating between 0 and 100. This part of the indicator measures the markets expansion and volatility allowing us to spot early exhaustion during trend. The indicator consists of three lines and when all 3 read over 95 we can begin looking for a bottom or reversal. Its secondary area are the solid lines (green/red) at the bottom of the indicator to make spotting these potential areas easier and to keep an eye on the market/orderbook/other indicators to spot the exhaustion.
A green line will print during downtrends and a red line during up trends as this is intended to align with the traditional buy/sell colours.
Finally the indicator comes with alerts for dot prints or a line print so you are free to set these up however you wish. My recommended time frames are 15m/1/2/4H with scalpers welcome to go as low as the 1min.
Script que requiere invitación
Solo los usuarios autorizados por el autor pueden acceder a este script. Tendrá que solicitar y obtener permiso para utilizarlo. Normalmente se concede previo pago. Para obtener más información, siga las instrucciones del autor o póngase en contacto directamente con Aevir.
TradingView NO recomienda pagar o utilizar un script a menos que confíe plenamente en su autor y entienda cómo funciona. También puede encontrar alternativas gratuitas de código abierto en nuestros scripts de la comunidad.
Instrucciones del autor
Advertencia: antes de solicitar acceso, lea nuestra guía relacionada con los scripts que requieren invitación.
Exención de responsabilidad
Script que requiere invitación
Solo los usuarios autorizados por el autor pueden acceder a este script. Tendrá que solicitar y obtener permiso para utilizarlo. Normalmente se concede previo pago. Para obtener más información, siga las instrucciones del autor o póngase en contacto directamente con Aevir.
TradingView NO recomienda pagar o utilizar un script a menos que confíe plenamente en su autor y entienda cómo funciona. También puede encontrar alternativas gratuitas de código abierto en nuestros scripts de la comunidad.
Instrucciones del autor
Advertencia: antes de solicitar acceso, lea nuestra guía relacionada con los scripts que requieren invitación.