OPEN-SOURCE SCRIPT
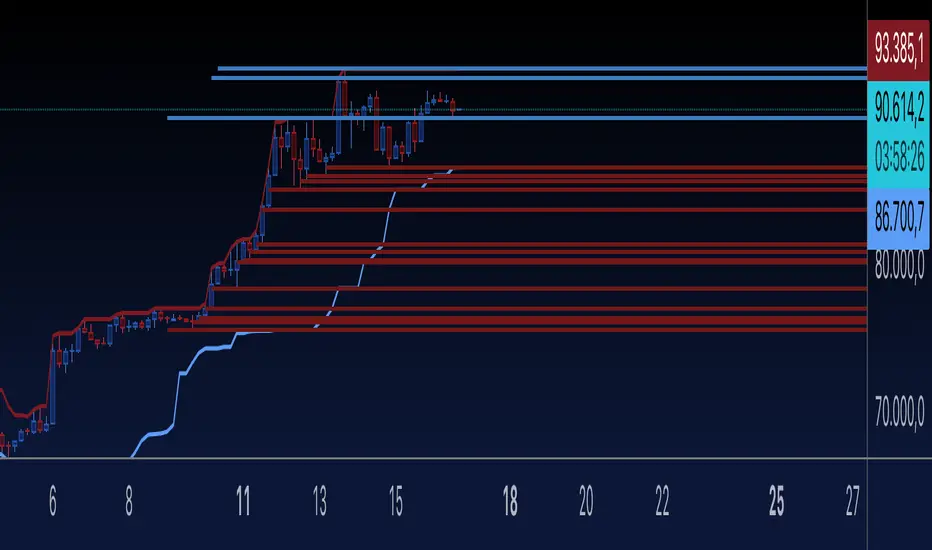
Dynamic Support and Resistance -AYNET
Explanation of the Code
Lookback Period:
The lookback input defines how many candles to consider when calculating the support (lowest low) and resistance (highest high).
Support and Resistance Calculation:
ta.highest(high, lookback) identifies the highest high over the last lookback candles.
ta.lowest(low, lookback) identifies the lowest low over the same period.
Dynamic Lines:
The line.new function creates yellow horizontal lines at the calculated support and resistance levels, extending them to the right.
Optional Plot:
plot is used to display the support and resistance levels as lines for visual clarity.
Customization:
You can adjust the lookback period and toggle the visibility of the lines via inputs.
How to Use This Code
Open the Pine Script Editor in TradingView.
Paste the above code into the editor.
Adjust the "Lookback Period for High/Low" to customize how the levels are calculated.
Enable or disable the support and resistance lines as needed.
This will create a chart similar to the one you provided, with horizontal yellow lines dynamically indicating the support and resistance levels. Let me know if you'd like any additional features or customizations!
Script de código abierto
Fiel al espíritu de TradingView, el creador de este script lo ha convertido en código abierto, para que los traders puedan revisar y verificar su funcionalidad. ¡Enhorabuena al autor! Aunque puede utilizarlo de forma gratuita, recuerde que la republicación del código está sujeta a nuestras Normas internas.
Exención de responsabilidad
La información y las publicaciones no constituyen, ni deben considerarse como asesoramiento o recomendaciones financieras, de inversión, de trading o de otro tipo proporcionadas o respaldadas por TradingView. Más información en Condiciones de uso.