Sniper Trade Fx Heat Map
The Sniper Trade Fx Heat Map is a custom oscillator built from a stack of 28 stochastic oscillators, arranged horizontally and vertically, creating a layered “heat map” view of market momentum.
Lower rows = short-term stochastics (faster, sensitive to quick moves).
Upper rows = long-term stochastics (slower, capture major swings).
Each stochastic value is interpreted and color-coded depending on strength.
The average of all 28 stochastics is calculated → this creates the Fast line.
The Fast line is then smoothed to create a Slow line for confirmation.
Optionally, the candle bars are colored to reflect the oscillator state.
This setup gives a multi-timeframe momentum map, showing when the market is overbought, oversold, or neutral at a glance.
🎨 Color Logic by Theme
🔹 Theme 1 (Classic)
High stochastic values (50–100) = Shades of Green → Overbought / bullish momentum.
Low stochastic values (0–50) = Shades of Red → Oversold / bearish momentum.
👉 This is the most traditional color scheme: Green = Up, Red = Down.
🔹 Theme 2 (Aqua / Purple)
High stochastic values (50–100) = Shades of Aqua / Teal → Overbought / bullish momentum.
Low stochastic values (0–50) = Shades of Purple / Violet → Oversold / bearish momentum.
👉 Useful if you prefer cooler tones to distinguish trend phases.
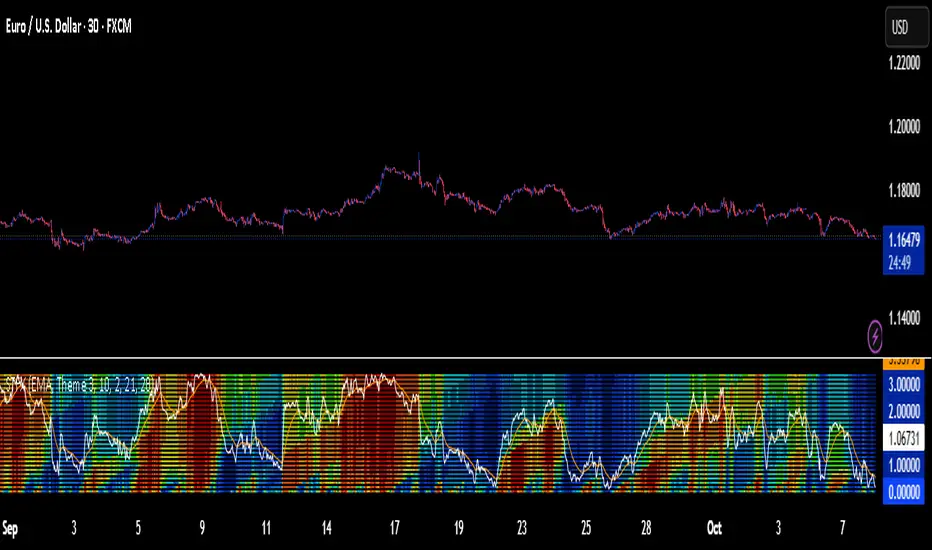
🔹 Theme 3 (Heat Spectrum)
High stochastic values (50–100) = Red → Yellow → Green gradient → Overbought / bullish momentum.
Deep Red = extremely overbought.
Yellow = mid-high.
Green = topping but stabilizing.
Low stochastic values (0–50) = Blue → Cyan gradient → Oversold / bearish momentum.
Dark Blue = extremely oversold.
Lighter Cyan = recovering.
👉 This theme gives a heat map feel, with red showing extreme highs and blue showing extreme lows.
📈 Trading Directions
Look at the Heat Map Layers
If most rows are the same color (all green, all aqua, or all red/yellow depending on theme), momentum is strongly aligned.
If colors are mixed (checkerboard), market is choppy → avoid trades.
Use Fast/Slow Oscillator Crossovers
Bullish Signal (Buy): Fast crosses above Slow while the heat map is showing oversold colors (Red in Theme 1, Purple in Theme 2, Blue in Theme 3).
Bearish Signal (Sell): Fast crosses below Slow while the heat map is showing overbought colors (Green in Theme 1, Aqua in Theme 2, Red/Yellow in Theme 3).
Bar Coloring for Entries
When enabled, candles will automatically reflect the dominant heat map color.
Enter trades when candle colors confirm the Fast/Slow crossover direction.
✅ Summary Rule of Thumb:
Theme 1: Green = overbought, Red = oversold.
Theme 2: Aqua = overbought, Purple = oversold.
Theme 3: Red/Yellow/Green = overbought, Blue/Cyan = oversold.
Script que requiere invitación
Solo los usuarios autorizados por el autor pueden acceder a este script. Tendrá que solicitar y obtener permiso para utilizarlo. Normalmente se concede previo pago. Para obtener más información, siga las instrucciones del autor o póngase en contacto directamente con snipertradefxconnect.
TradingView NO recomienda pagar o utilizar un script a menos que confíe plenamente en su autor y entienda cómo funciona. También puede encontrar alternativas gratuitas de código abierto en nuestros scripts de la comunidad.
Instrucciones del autor
Exención de responsabilidad
Script que requiere invitación
Solo los usuarios autorizados por el autor pueden acceder a este script. Tendrá que solicitar y obtener permiso para utilizarlo. Normalmente se concede previo pago. Para obtener más información, siga las instrucciones del autor o póngase en contacto directamente con snipertradefxconnect.
TradingView NO recomienda pagar o utilizar un script a menos que confíe plenamente en su autor y entienda cómo funciona. También puede encontrar alternativas gratuitas de código abierto en nuestros scripts de la comunidad.