OPEN-SOURCE SCRIPT
Zone Color Pattern

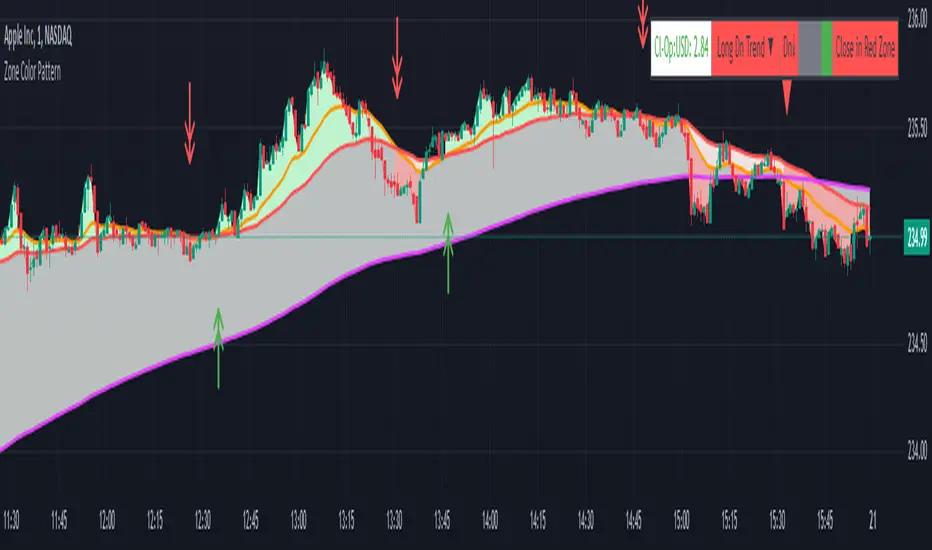
Zone Color Pattern indicator depicts the color pattern of zones on chart. This will help the user to identify the zones on Chart.
Green Zone is indicated by Green color.
Red Zone is indicated by Red Color.
Gray Zone is indicated by Gray Zone.
Zone Color Pattern indicator is based on 3 moving averages. Long term, Medium term and Short Term.By default they are 200, 50 and 20.
When you are on long term trend the position of MAs is 20 MA is on top,then comes 50 MA and 200 MA is positioned below 50 MA.The position of respective MAs change during down trend.
The color patterns display the distance between different MAs .The widening and contraction of space between different Moving Averages indicate the movement and direction of price.
Basically price tend to move in and move away from Average. This action tend to create a space between price and MAs.Color patterns between price and MAs reflect the gap between the price and M|As .All these effects can be visualized on chart in relevant colors to infer the status of price, movement, cross over by the User.
Buy trades are preferred when close is in Green Zone and price is above MA20.
Sell trades are preferred when close is in Red Zone and price is below MA20
Trades may be avoided when close is in Gray Zone.
Long Up Trend and Down Trend respective color triangle shapes and arrows on chart indicate the trends and direction.
The chart understanding has to be supplemented with other regular indicators along with appropriate risk reward techniques by user.
Table indicate difference between Last Price traded and Day open price.
Other columns in table display the position of close in different Zones.
DISCLAIMER: For educational and entertainment purpose only .Nothing in this content should be interpreted as financial advice or a recommendation to buy or sell any sort of security/ies or investment/s.
Script de código abierto
Fiel al espíritu de TradingView, el creador de este script lo ha convertido en código abierto, para que los traders puedan revisar y verificar su funcionalidad. ¡Enhorabuena al autor! Aunque puede utilizarlo de forma gratuita, recuerde que la republicación del código está sujeta a nuestras Normas internas.
Exención de responsabilidad
La información y las publicaciones no constituyen, ni deben considerarse como asesoramiento o recomendaciones financieras, de inversión, de trading o de otro tipo proporcionadas o respaldadas por TradingView. Más información en Condiciones de uso.