OPEN-SOURCE SCRIPT
Actualizado [blackcat] L3 CCI-RSI Combo
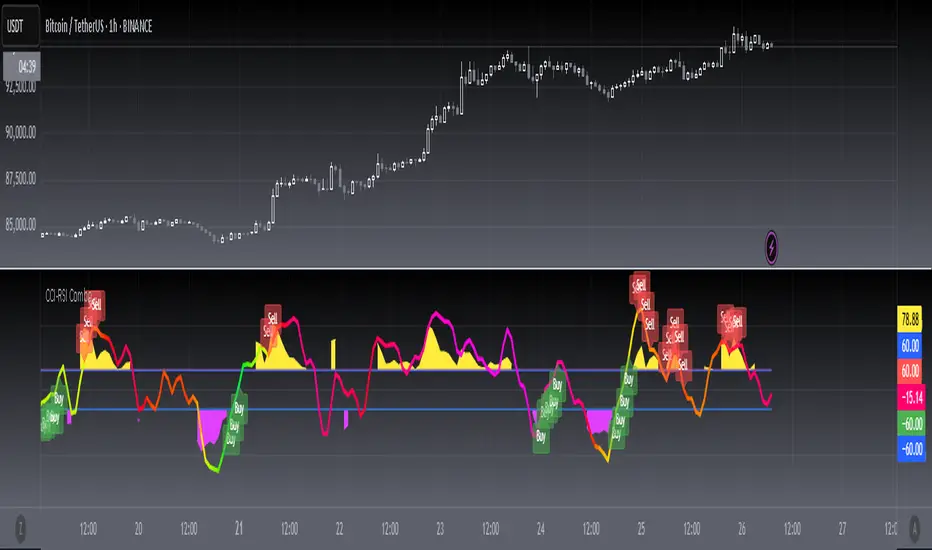
CCI-RSI Combo indicator is a combination indicator that includes CCI and RSI. It uses some parameters to calculate the values of CCI and RSI, and generates corresponding charts based on these values. On the chart, when CCI exceeds 100 or falls below -100, yellow or magenta filling areas are displayed. Additionally, gradient colors are used on the RSI chart to represent different value ranges. Based on the values of CCI and RSI, buying or selling signals can be identified and "B" or "S" labels are displayed at the corresponding positions. It utilizes some technical indicators and logic to generate buying and selling signals, and displays the corresponding labels on the chart.
Here are the main parts of the code:
1. Definition of some variables:
- `N`, `M`, `N1`: Parameters used to calculate CCI and RSI.
- `xcn(cond, len)` and `xex(cond, len)`: Two functions used to calculate the number of times a condition is met.
2. Calculation of CCI (Commodity Channel Index):
- Calculate the CCI value based on the formula `(TYP - ta.sma(TYP, M)) / (0.015 * ta.stdev(TYP, M))`.
- Use the `plot()` function to plot CCI on the chart and set the color based on its value.
3. Calculation of RSI (Relative Strength Index):
- First calculate RSI1 by taking the average of positive differences between closing prices and the average of all absolute differences, and then multiplying by 100.
- Then use the ALMA function to transform RSI1 into a smoother curve.
- Use the `plot()` function to plot RSI on the chart and select gradient colors for shading based on its value.
4. Setting up the gradient color array:
- Create a color array using `array.new_color()` and add a series of color values to it.
5. Generating buying and selling signals based on conditions:
- Use logical operators and technical indicator functions to determine the conditions for buying and selling.
- Use the `label.new()` function to draw the corresponding labels on the chart to represent buying or selling signals.
Notas de prensa
OVERVIEWThe [blackcat] L3 CCI-RSI Combo indicator combines the Commodity Channel Index (CCI) with a modified Relative Strength Index (RSI) to provide traders with enhanced insights into market momentum and potential trend reversals 📈💹. This script calculates both indicators using custom functions and plots them on separate panels for clear visualization.
FEATURES
Combines Commodity Channel Index (CCI) and Relative Strength Index (RSI):
N Periods: Number of periods used in RSI calculation.
M Periods: Number of periods used in CCI calculation.
N1 Periods: Additional period setting for RSI smoothing.
Plots CCI values with dynamic coloring based on their magnitude:
Yellow: Above upper limit.
Fuchsia: Below lower limit.
Displays a gradient-colored RSI line for better visual interpretation.
Includes upper and lower limits for CCI to highlight extreme values.
Generates buy ('Buy') and sell ('Sell') labels based on specific conditions.
Provides alert functionality for long and short signals 🔔
HOW TO USE
Add the indicator to your TradingView chart by selecting it from the indicators list.
Adjust the N Periods, M Periods, and N1 Periods parameters as needed.
Monitor the CCI and RSI lines on their respective panels.
Look for buy and sell labels indicating potential trade opportunities.
Set up alerts based on the generated signals to receive notifications when conditions are met 📲.
LIMITATIONS
The indicator may generate false signals in highly volatile or ranging markets 🌪️.
Users should combine this indicator with other forms of analysis for more reliable trading decisions.
The effectiveness of the indicator may vary depending on the asset and timeframe being analyzed.
NOTES
Ensure that you have sufficient historical data available for accurate calculations.
Test the indicator thoroughly on demo accounts before applying it to live trading 🔍.
Customize the appearance and parameters as needed to fit your trading strategy.
Script de código abierto
Fiel al espíritu de TradingView, el creador de este script lo ha convertido en código abierto, para que los traders puedan revisar y verificar su funcionalidad. ¡Enhorabuena al autor! Aunque puede utilizarlo de forma gratuita, recuerde que la republicación del código está sujeta a nuestras Normas internas.
Avoid losing contact!Don't miss out! The first and most important thing to do is to join my Discord chat now! Click here to start your adventure: discord.com/invite/ZTGpQJq 防止失联,请立即行动,加入本猫聊天群: discord.com/invite/ZTGpQJq
Exención de responsabilidad
La información y las publicaciones no constituyen, ni deben considerarse como asesoramiento o recomendaciones financieras, de inversión, de trading o de otro tipo proporcionadas o respaldadas por TradingView. Más información en Condiciones de uso.