OPEN-SOURCE SCRIPT
FCBI Brake Pressure
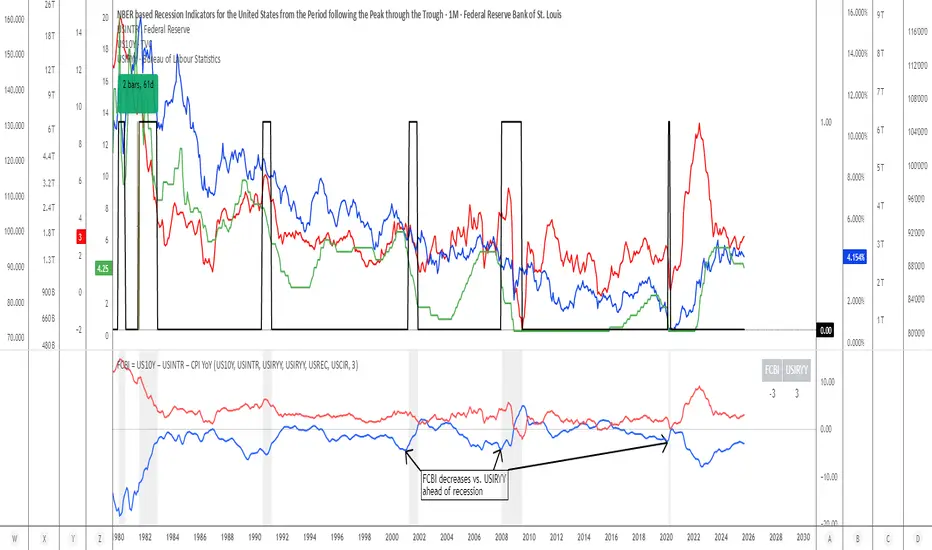
Brake Pressure (FCBI − USIRYY)
Concept
The Brake Pressure indicator quantifies whether the bond market is braking or releasing liquidity relative to real yields (USIRYY).
It is derived from the Financial-Conditions Brake Index (FCBI) and expresses the balance between long-term yield pressure and real-rate dynamics.
Formula
Brake Pressure = FCBI − USIRYY
where FCBI = (US10Y) − (USINTR) − (CPI YoY)
Purpose
While FCBI measures the intensity of financial-condition pressure, Brake Pressure shows when that brake is being applied or released.
It captures the turning point of liquidity transmission in the financial system.
How to Read
Brake Pressure < 0 (orange) → Brake engaged → financial conditions tighter than real-rate baseline; liquidity constrained.
Brake Pressure ≈ 0 → Neutral zone → transition phase between tightening and easing.
Brake Pressure > 0 (teal) → Brake released → financial conditions looser than real-rate baseline; liquidity flows freely → late-cycle setup before recession.
Zero-Cross Logic
Cross ↑ above 0 → FCBI > USIRYY → brake released → liquidity acceleration → typically 6–18 months before recession.
Cross ↓ below 0 → FCBI < USIRYY → brake re-engaged → tightening resumes.
Historical Behavior
Each major U.S. recession (2001, 2008, 2020) was preceded by a Brake Pressure cross above zero after a negative phase, signaling that long yields had stopped resisting Fed cuts and liquidity was expanding.
Practical Use
• Identify late-cycle turning points and liquidity inflection phases.
• Combine with FCBI for a complete macro transmission picture.
• Watch for sustained positive readings as early macro-recession warnings.
Current Example (Oct 2025)
FCBI ≈ −3.1, USIRYY ≈ +3.0 → Brake Pressure ≈ −6.1 → Brake still engaged. When this crosses above 0, it signals that liquidity is free flowing and the recession countdown has begun.
Summary
FCBI shows how tight the brake is. Brake Pressure shows when the brake releases.
When Brake Pressure > 0, the system has entered the liquidity-expansion phase that historically precedes a U.S. recession.
Script de código abierto
Fiel al espíritu de TradingView, el creador de este script lo ha convertido en código abierto, para que los traders puedan revisar y verificar su funcionalidad. ¡Enhorabuena al autor! Aunque puede utilizarlo de forma gratuita, recuerde que la republicación del código está sujeta a nuestras Normas internas.
Exención de responsabilidad
La información y las publicaciones no constituyen, ni deben considerarse como asesoramiento o recomendaciones financieras, de inversión, de trading o de otro tipo proporcionadas o respaldadas por TradingView. Más información en Condiciones de uso.