OPEN-SOURCE SCRIPT
Actualizado Position Tracker
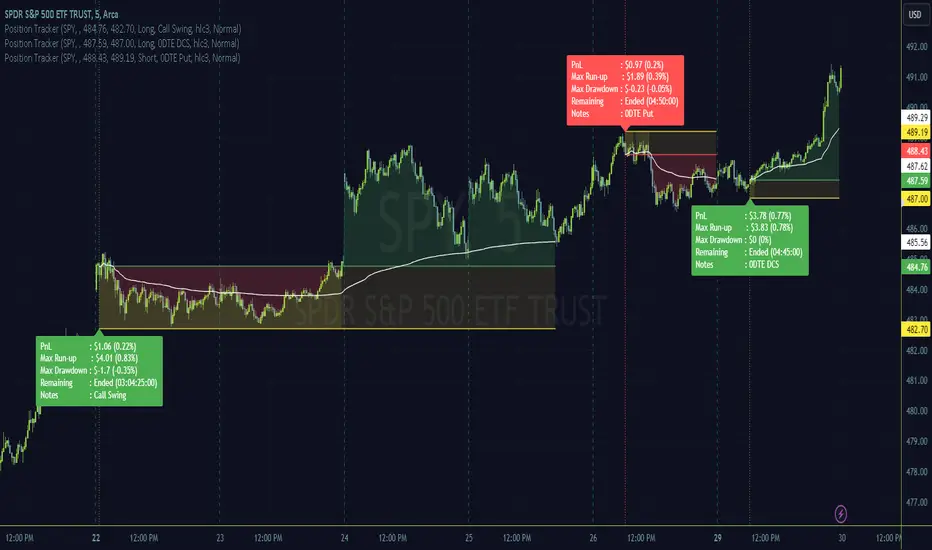
Use this tool to plot a trading position on the chart, using the guided confirmation prompts after adding to the chart.
To use this tool, after adding to the chart it will prompt for entry and exit time and entry price selection which will require using a mouse or touch screen to complete the action; the prompts appear at the bottom of the chart and are a blue bubble/box looking object :)
It will provide a readout of the live profit and loss, run-up and drawdown of a trade as well as present notes if added.
Visuals provide an easy look at periods of drawdown, and a anchored vwap is included as a simple guide for trade management.
Setting the symbol will allow many instances of the tool on the same layout and each instance will hide it's display while not on the matching symbol chart.
Once the end time for the trade is met, the label with trade breakdown thoughtfully moves away from active price and can be seen by scrolling to trade entry area.
If there's enough interest I will add some additional features but wanted to start simple. Or feel free to copy and make it your own!
Thanks and happy trading.
Notas de prensa
Ensuring I've not broken any house rules, no actual functionality adjustments.Script de código abierto
Fiel al espíritu de TradingView, el creador de este script lo ha convertido en código abierto, para que los traders puedan revisar y verificar su funcionalidad. ¡Enhorabuena al autor! Aunque puede utilizarlo de forma gratuita, recuerde que la republicación del código está sujeta a nuestras Normas internas.
@tradeseekers (YouTube, Twitter)
Exención de responsabilidad
La información y las publicaciones no constituyen, ni deben considerarse como asesoramiento o recomendaciones financieras, de inversión, de trading o de otro tipo proporcionadas o respaldadas por TradingView. Más información en Condiciones de uso.
Script de código abierto
Fiel al espíritu de TradingView, el creador de este script lo ha convertido en código abierto, para que los traders puedan revisar y verificar su funcionalidad. ¡Enhorabuena al autor! Aunque puede utilizarlo de forma gratuita, recuerde que la republicación del código está sujeta a nuestras Normas internas.
@tradeseekers (YouTube, Twitter)
Exención de responsabilidad
La información y las publicaciones no constituyen, ni deben considerarse como asesoramiento o recomendaciones financieras, de inversión, de trading o de otro tipo proporcionadas o respaldadas por TradingView. Más información en Condiciones de uso.