OPEN-SOURCE SCRIPT
Actualizado Urika Trend Strength
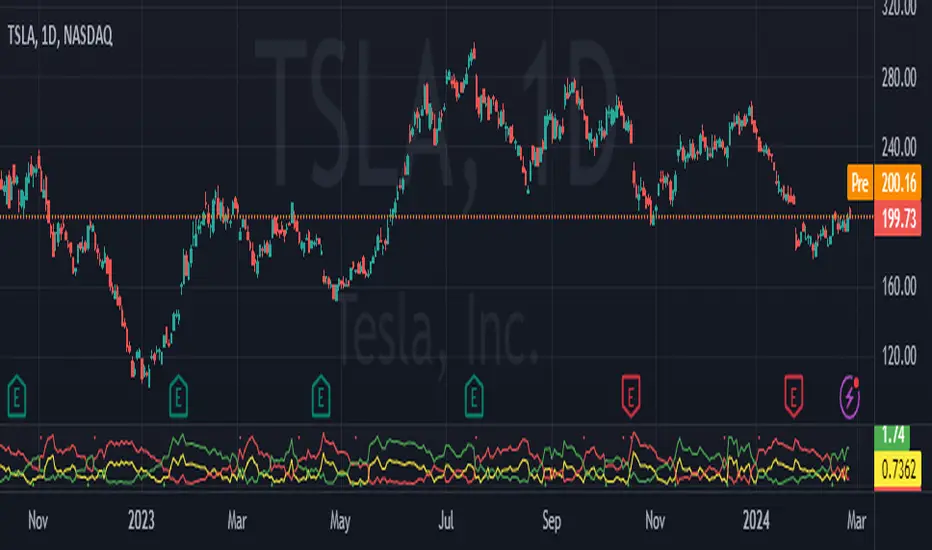
The Urika Directional Strength (UDS) indicator calculates and visualizes the strength of the directional trend in the price data. It helps traders see the strength and direction of the trend and allows them to make informed trading decisions based on trend changes.
Calculation:
The Simple Moving Average is used to determine the upper and lower directional bands by adding and subtracting the product of the standard deviation of the price data and the multiplier of the moving average.
Direction: The upward directional trend and downward directional trend are calculated by taking the absolute value of the difference between the price data and the upper and lower directional bands, divided by the product of the standard deviation and the multiplier.
Strength: It is calculated by taking the absolute value of the difference between the price data and the moving average, divided by the product of the standard deviation and the multiplier.
Interpretation:
Direction: The position of the long and short lines at the top indicates the direction of the ticker. Long line for long position and Short line for short position.
Strength: When the Strength line is below the directional lines, it is a weak trend or consolidating. If it stays in between the two directional lines, it is a strong trend.
Notas de prensa
The Urika Trend Strength (UTS) indicator calculates and visualizes the strength of the directional trend in the price data. It helps traders see the strength and direction of the trend and allows them to make informed trading decisions based on trend changes.Calculation:
The Simple Moving Average is used to determine the upper and lower directional bands by adding and subtracting the product of the standard deviation of the price data and the multiplier of the moving average.
Direction: The upward directional trend and downward directional trend are calculated by taking the absolute value of the difference between the price data and the upper and lower directional bands, divided by the product of the standard deviation and the multiplier.
Strength: It is calculated by taking the absolute value of the difference between the price data and the moving average, divided by the product of the standard deviation and the multiplier.
Interpretation:
Direction: The position of the long and short lines at the top indicates the direction of the ticker. Long line for long position and Short line for short position.
Strength: When the Strength line is below the directional lines, it is a weak trend or consolidating. If it stays in between the two directional lines, it is a strong trend.
Notas de prensa
I updated the name in the description to reflect that with the code.Script de código abierto
Fiel al espíritu de TradingView, el creador de este script lo ha convertido en código abierto, para que los traders puedan revisar y verificar su funcionalidad. ¡Enhorabuena al autor! Aunque puede utilizarlo de forma gratuita, recuerde que la republicación del código está sujeta a nuestras Normas internas.
Exención de responsabilidad
La información y las publicaciones no constituyen, ni deben considerarse como asesoramiento o recomendaciones financieras, de inversión, de trading o de otro tipo proporcionadas o respaldadas por TradingView. Más información en Condiciones de uso.
Script de código abierto
Fiel al espíritu de TradingView, el creador de este script lo ha convertido en código abierto, para que los traders puedan revisar y verificar su funcionalidad. ¡Enhorabuena al autor! Aunque puede utilizarlo de forma gratuita, recuerde que la republicación del código está sujeta a nuestras Normas internas.
Exención de responsabilidad
La información y las publicaciones no constituyen, ni deben considerarse como asesoramiento o recomendaciones financieras, de inversión, de trading o de otro tipo proporcionadas o respaldadas por TradingView. Más información en Condiciones de uso.