PROTECTED SOURCE SCRIPT
Litt Heat Map
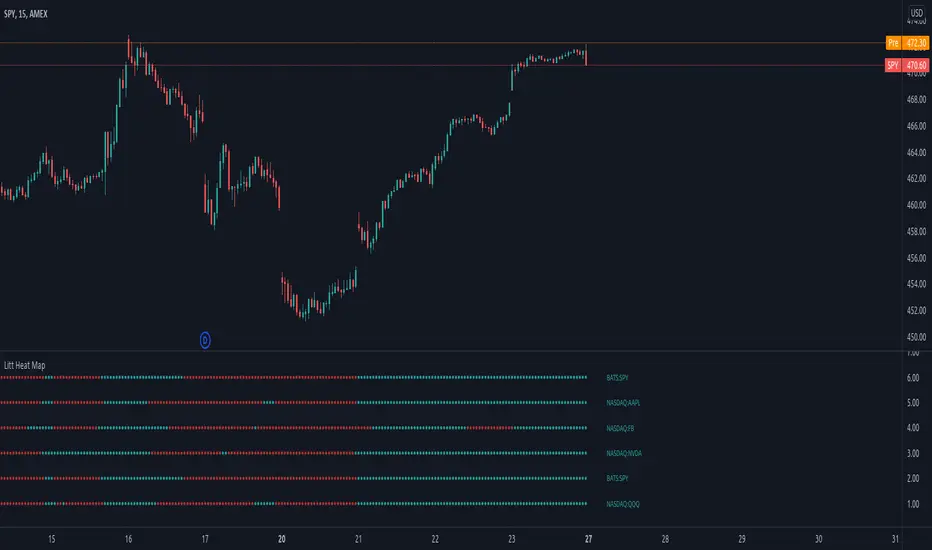
The Litt Heap Map uses the MA Line (Moving Average Line) from Litt Pro Indicators. The Heat Map tells the trader the trend direction based on MA 1 and MA 2.
If the value of MA 1 is greater than the value of MA 2 then the MA Line is colored Bull.
If the value of MA 1 is less than the value of MA 2 then the MA Line is colored Bear.
The Litt Heat Map allows you to see the MA Line for multiple symbols on 1 chart! You can use the Heat Map as a scanner to see when trend has changed, or as a trend confirmation tool when multiple symbols are aligning.
Script protegido
Este script se publica como código cerrado. No obstante, puede utilizarlo libremente y sin ninguna limitación. Obtenga más información aquí.
Exención de responsabilidad
La información y las publicaciones no constituyen, ni deben considerarse como asesoramiento o recomendaciones financieras, de inversión, de trading o de otro tipo proporcionadas o respaldadas por TradingView. Más información en Condiciones de uso.