OPEN-SOURCE SCRIPT
Multi-Timeframe 325 SMA Touch
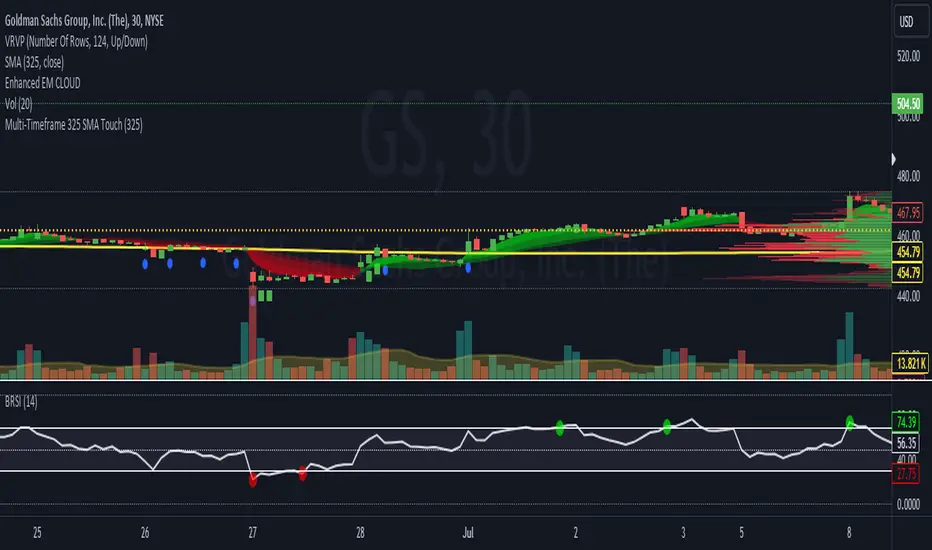
Multi-Timeframe 325 SMA Touch Indicator
This versatile indicator detects and visualizes when the price touches (crosses over or under) the 325-period Simple Moving Average (SMA) across multiple timeframes. It's designed to help traders identify potential support and resistance levels across various time horizons.
Key Features:
Monitors 7 different timeframes: 30 minutes, 1 hour, 2 hours, 4 hours, 6 hours, 12 hours, and 1 day.
Customizable: Each timeframe can be toggled on or off individually.
Visual cues: Unique shapes and colors for each timeframe make it easy to distinguish touches on different time scales.
Adjustable SMA length: While defaulted to 325 periods, the SMA length can be modified to suit your strategy.
Current timeframe SMA: Displays the 325 SMA on the chart for additional context.
How it Works:
The indicator checks for price touches on the 325 SMA for each selected timeframe. When a touch occurs, it plots a distinct shape below the price bar:
30 minutes: Blue circle
1 hour: Green square
2 hours: Red triangle (up)
4 hours: Purple diamond
6 hours: Teal triangle (down)
12 hours: Orange X
1 day: White circle
The 325 SMA for the current chart timeframe is also plotted as a yellow line for reference.
Use Cases:
Identify potential support and resistance levels across multiple timeframes
Spot confluences where touches occur on multiple timeframes simultaneously
Enhance your multi-timeframe analysis for more informed trading decisions
Use as a filter or confirmation tool in your existing trading strategy
Customization:
You can easily customize the indicator by adjusting the SMA length or toggling specific timeframes on/off to focus on the time horizons most relevant to your trading style.
Script de código abierto
Fiel al espíritu de TradingView, el creador de este script lo ha convertido en código abierto, para que los traders puedan revisar y verificar su funcionalidad. ¡Enhorabuena al autor! Aunque puede utilizarlo de forma gratuita, recuerde que la republicación del código está sujeta a nuestras Normas internas.
Exención de responsabilidad
La información y las publicaciones no constituyen, ni deben considerarse como asesoramiento o recomendaciones financieras, de inversión, de trading o de otro tipo proporcionadas o respaldadas por TradingView. Más información en Condiciones de uso.